
|
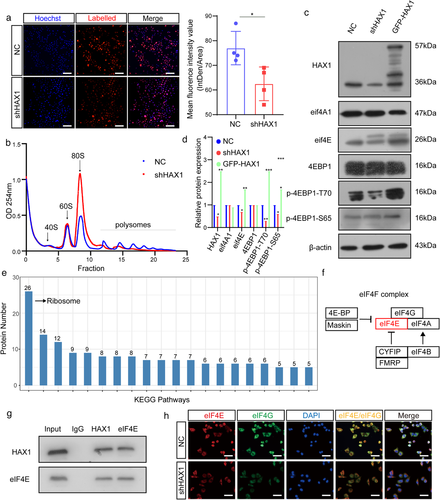
Fig. 6 HAX1 promotes protein translation in HUVECs. (a) Analyses of nascent protein synthesis labeled with L-Homopropargyl glycine incorporation, detected in HUVECs-NC and HUVECs-shHAX1 by fluorescence microscopy. Quantify nascent protein expression by the quantification of fluorescence intensity. Blue: nuclei; Red: nascent protein, bar: 100 µm. (*p < 0.05, Student's t-test). (b) Polysome profiling of HUVECs-NC and HUVECs-shHAX1. Absorbance at 254 nm. (c, d) Western blot analysis of the protein levels in HUVECs-NC and HUVECs-shHAX1 (*p < 0.05, **p < 0.01, p < 0.001, Student's t-test). (e) KEGG pathway enrichment analysis of the mass spectrometry results. (f) Schematic diagram of HAX1 affecting eIF4F. (g) Co-immunoprecipitation analysis between HAX1 and eIF4E in HUVECs. (h) Immunofluorescence of eIF4G and eIF4E in HUVECs, bar: 50 µm