
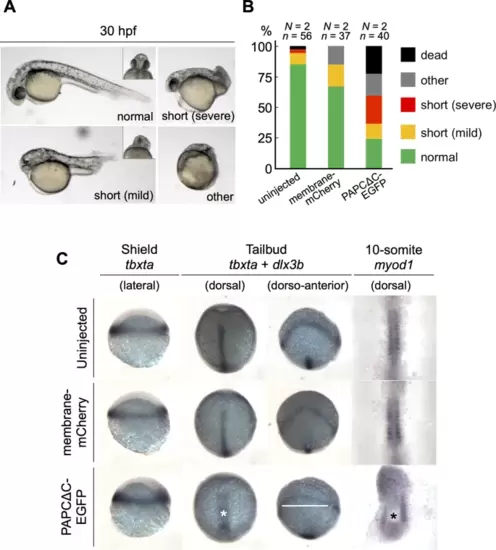
The expression of PAPCΔC disrupts axis elongation during zebrafish development. (A) Embryos with various degrees of morphogenetic anomalies at 30 hpf. (Left top) A normal embryo. The inset shows the ventral view of the head region, with well-separated eyes. (Right top) A severe case of a shortened axis, classified by an axial length of approximately < 50% of that of a normal embryo, while both the anterior (eyes) and posterior (tail) structures are discernible. (Left bottom) A mild case of a shortened axis, classified by an axial length of approximately 50–80% of that of a normal embryo, accompanied by cyclopia (inset). (Right bottom) An embryo with severe developmental defects. (B) Morphogenetic phenotypes at 30 hpf. Fifty-six uninjected, 37 membrane-mCherry mRNA-injected, and 40 PAPCΔC-EGFP mRNA-injected embryos from two independent experiments were analyzed. (C) Whole mount in situ hybridization using probes for tbxta, dlx3b and myod1 at the shield, tailbud and 10-somite stages. The yolk was removed, and the embryos were mounted flat for 10-somite specimens. The asterisks and a white bar denote broader and shorter notochords and broader neural plate, respectively, in PAPCΔC-EGFP mRNA-injected embryos. Embryos from four independent experiments were analyzed. |
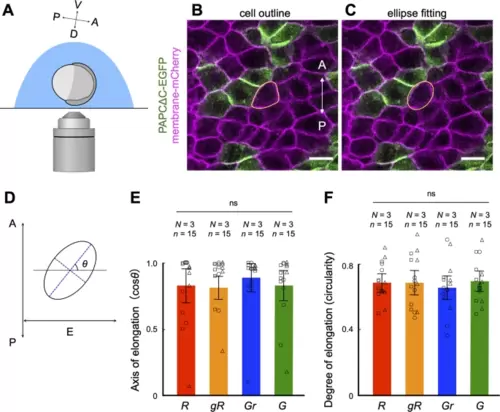
PAPCΔC expressing cells polarize normally in the developing notochord. (A) A diagram showing the orientation of the embryo at the beginning of confocal microscopy (60% epiboly, see Methods). A–P and D–V indicate the anterior–posterior and dorsal–ventral axes, respectively. (B, C) Confocal images of axial mesodermal cells in an embryo expressing membrane-mCherry uniformly and PAPCΔC-EGFP in a mosaic fashion at 9 hpf. A–P indicates the anterior–posterior axis. Scale bars, 25 μm. (B) The outline of a cell (expressing membrane-mCherry and in contact with cells expressing PAPCΔC) is manually traced in yellow. (C) The outline of the same cell is fitted to an ellipse. (D) Evaluation of cell polarization via ellipse fitting. The axis of cell elongation was evaluated by the angle of the long axis of the ellipse (blue dotted line) to the equatorial line (E), which is perpendicular to the anterior–posterior (A–P) axis. The degree of cell elongation is evaluated by the circularity of the ellipse, which is determined by the length of the short axis (purple dotted line) divided by the long axis. (E, F) Axis of elongation (cosθ) (D) and degree of elongation (circularity) (E) of cells. Here, the cells were categorized into four categories according to their expression of PAPCΔC as well as contact with (an)other PAPCΔC-expressing cell(s): R, cells expressing mCherry only and surrounded by cells expressing mCherry only; gR, cells expressing mCherry only and in contact with PAPACΔC-expressing cell(s); Gr, cells expressing PAPCΔC and surrounded by cells expressing mCherry only; G, cells expressing PAPCΔC and in contact with (an)other PAPCΔC-expressing cell(s). Fifteen cells (n = 15) from three independent experiments (N = 3) were analyzed. ns, not significant (one-way ANOVA). The data are presented as the means ± s.d. Squares, circles and triangle represent single data points from three independent experiments. |
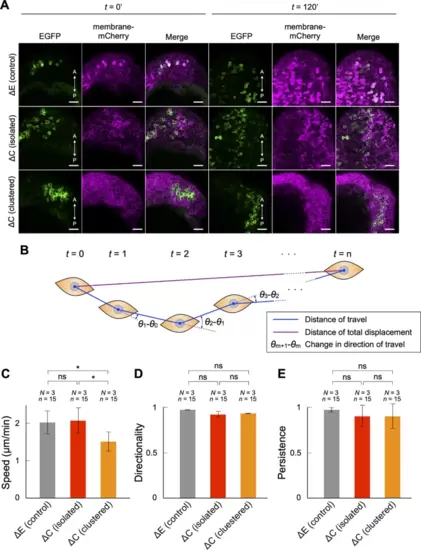
The speed of cell migration in the developing notochord was reduced in PAPCΔC-expressing cells in a homophilic contact-dependent manner. (A–D) PAPCΔC-EGFP was expressed either in a cell cluster or in a mosaic fashion, and the cell positions were tracked during gastrulation. EGFP-PAPCΔE was used as a control. (A) Representative images of control embryos (ΔE [control]), embryos expressing PAPCΔC-EGFP in a mosaic fashion (ΔC [isolated]) and embryos expressing PAPCΔC-EGFP in a cluster (ΔC [clustered]), at the beginning (t = 0’) and end (t = 120’) of confocal microscopy. Scale bars: 50 μm. (B) A schematic diagram of cell tracking. The distance traveled between timepoints (blue lines), the distance of total displacement (purple line), and the change in direction of travel between timepoints (arcs) were extracted. (C) The speed of cell migration (µm/min) was calculated as the sum of the distance traveled by a cell divided by time. (D) The directionality of cell migration was calculated as the distance of total displacement divided by the sum of the total distance traveled. (E) The persistence of cell migration was calculated by the mean of cosθ, where θ represents the angle of directional change between the timepoints. Fifteen cells (n = 15) from three independent experiments (N = 3) were analyzed. * p < 0.05, ns, not significant (Tukey’s HSD test). The data are presented as the mean ± s.d. values. |
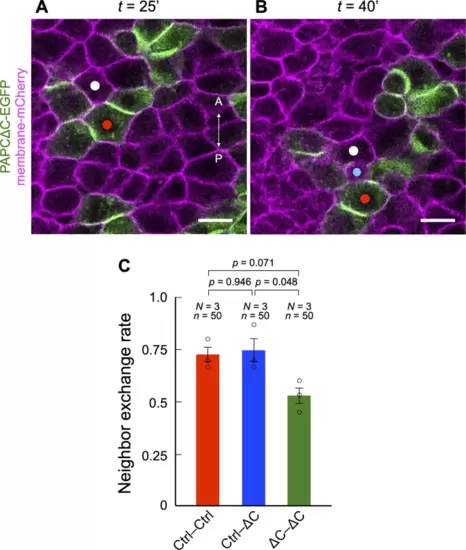
The frequency of neighbor exchange in the developing notochord was attenuated between PAPCΔC-expressing cells in a homophilic contact. (A, B) Pairs of cells in direct contact (white and red dots) were chosen and tracked for as long as they were within the field of view. Neighbor exchange was recorded when a third cell (blue dot) appeared between the original cell pair. Scale bars, 25 μm. (C) The frequency of neighbor exchange was significantly reduced in pairs of PAPCΔC-expressing cells. Fifty pairs (n = 50) from three independent experiments (N = 3) were analyzed for each pairing. P values were determined by Tukey’s HSD test after one-way ANOVA. |
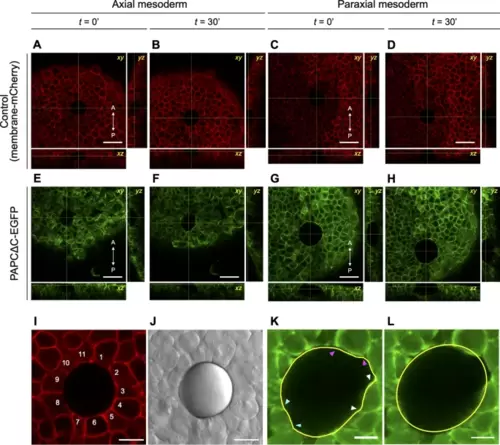
Insertion of an oil droplet among cells in zebrafish embryos. (A–H) An oil droplet inserted in the axial mesoderm (A, B, E, F) or paraxial mesoderm (C, D, G, H), in a control (expressing membrane-mCherry alone; A–D) or PAPCΔC-EGFP-expressing embryo (E–H). The outline of the droplet was tracked for 1.5 hours, starting at approximately 60% epiboly. (A, C, E, G) Images captured at the beginning of time-lapse observation (t = 0’). (B, D, F, H) Images captured 30 min later (t = 30’). Orthogonal views are also shown. A–P indicates the anterior–posterior axis. (I, J) A typical result of oil droplet insertion via confocal (I) and bright field (J) microscopy. At its largest perimeter, the droplet was in contact with ~ 10 cells (I). (K) The outline of a droplet at its largest perimeter was traced manually (in yellow). Occasional “dents” in the contour (marked by pairs of arrowheads in different colors) corresponded to the sizes of single cells in contact, suggesting that they were caused by cell-scale stresses exerted on the droplet. (L) The outline of the droplet, fitted to an ellipse (in yellow). Scale bars, 50 μm (A–H), 20 μm (I, J), 12.5 μm (K, L). |
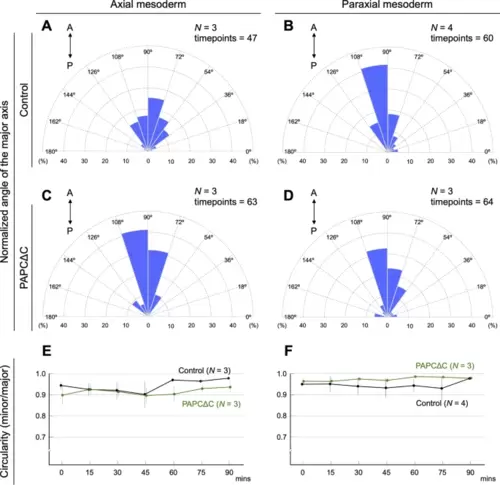
The expression of PAPCΔC biased the direction of supracellular stress in the developing notochord. (A-D) Distributions of the normalized angle of the major axis of the ellipse are plotted in rose diagrams (see Methods). (A) Axial mesoderm of the control embryos (expressed with membrane-mCherry). (B) Paraxial mesoderm of the control embryos. (C) Axial mesoderm of PAPCΔC-expressing embryos. (D) Paraxial mesoderm of PAPCΔC-expressing embryos. In the axial mesoderm, where endogenous PAPC is suppressed, the distribution of the normalized angle of the major axis was significantly shifted (towards average) by PAPCΔC expression (α < 0.005, Mardia–Watson–Wheeler test) (A, C). In the paraxial mesoderm, where endogenous PAPC is highly expressed, the expression of PAPCΔC had no significant effect on the distribution of the direction of the major axis (0.05 < α < 0.975, Mardia–Watson–Wheeler test) (B, D). The number of embryos analyzed (n) and the timepoints included in the plot are shown in each panel. (E, F) The circularity of the oil droplet (the ratio between the major and minor axes: minor/major) was calculated every 15 min in the axial (E) and paraxial mesoderm (F), with or without PAPCΔC expression. The data are shown in as the mean ± s.d. values. |
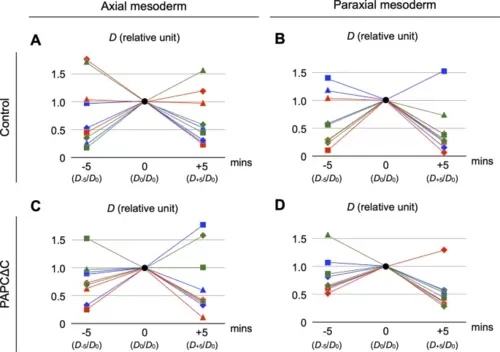
PAPCΔC expression did not affect fluctuations in the cell-scale stresses in either the axial or the paraxial mesoderm. (A–D) The distance between the fitted ellipse and the deformation (“dent” or “regression”) in the actual contour (D) was used as a proxy for cell-scale stresses. D was measured at a given timepoint, and its relative changes in five minutes before and after were plotted for the axial (A, C) and paraxial (B, D) mesoderm, with (C, D) or without (A, B) expression of PAPCΔC (see Methods). Three samples (displayed in squares, diamonds and triangles) were analyzed from each of three independent experiments (displayed in red, blue and green). In each condition, D constantly showed rapid fluctuations with comparable sizes (p = 0.22, one-way ANOVA). |
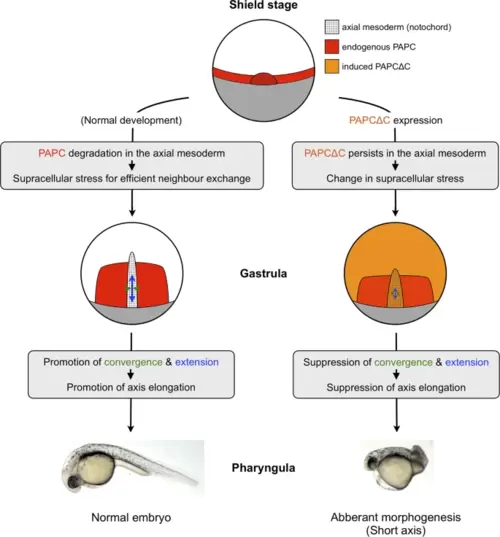
A schematic summary of this study. PAPC lacking its intracellular domain (PAPCΔC) induced in zebrafish embryos was resistant to degradation in the axial mesoderm and caused morphogenetic defects (short axis). In the developing notochord, PAPCΔC-expressing cells exhibited a decrease in migration speed as well as in neighbor exchange (NE), an essential cell behavior for morphogenetic cell movements (convergence and extension; C&E). Furthermore, PAPCΔC expression was found to modify supracellular stress in the notochord region. These results suggest that spatio-temporal suppression of PAPC may be required for optimizing the balance between cell-scale and supracellular stresses to facilitate morphogenetic cell behavior in early embryogenesis. |