
|
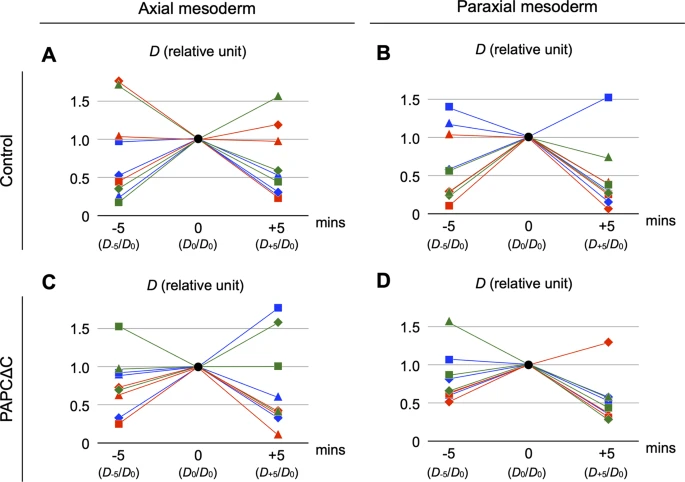
Fig. 7 PAPCΔC expression did not affect fluctuations in the cell-scale stresses in either the axial or the paraxial mesoderm. (A–D) The distance between the fitted ellipse and the deformation (“dent” or “regression”) in the actual contour (D) was used as a proxy for cell-scale stresses. D was measured at a given timepoint, and its relative changes in five minutes before and after were plotted for the axial (A, C) and paraxial (B, D) mesoderm, with (C, D) or without (A, B) expression of PAPCΔC (see Methods). Three samples (displayed in squares, diamonds and triangles) were analyzed from each of three independent experiments (displayed in red, blue and green). In each condition, D constantly showed rapid fluctuations with comparable sizes (p = 0.22, one-way ANOVA).