
|
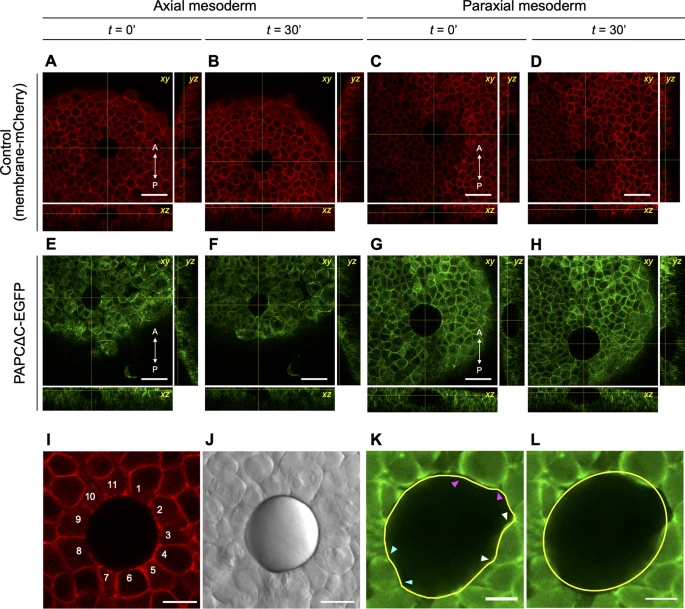
Fig. 5 Insertion of an oil droplet among cells in zebrafish embryos. (A–H) An oil droplet inserted in the axial mesoderm (A, B, E, F) or paraxial mesoderm (C, D, G, H), in a control (expressing membrane-mCherry alone; A–D) or PAPCΔC-EGFP-expressing embryo (E–H). The outline of the droplet was tracked for 1.5 hours, starting at approximately 60% epiboly. (A, C, E, G) Images captured at the beginning of time-lapse observation (t = 0’). (B, D, F, H) Images captured 30 min later (t = 30’). Orthogonal views are also shown. A–P indicates the anterior–posterior axis. (I, J) A typical result of oil droplet insertion via confocal (I) and bright field (J) microscopy. At its largest perimeter, the droplet was in contact with ~ 10 cells (I). (K) The outline of a droplet at its largest perimeter was traced manually (in yellow). Occasional “dents” in the contour (marked by pairs of arrowheads in different colors) corresponded to the sizes of single cells in contact, suggesting that they were caused by cell-scale stresses exerted on the droplet. (L) The outline of the droplet, fitted to an ellipse (in yellow). Scale bars, 50 μm (A–H), 20 μm (I, J), 12.5 μm (K, L).