
|
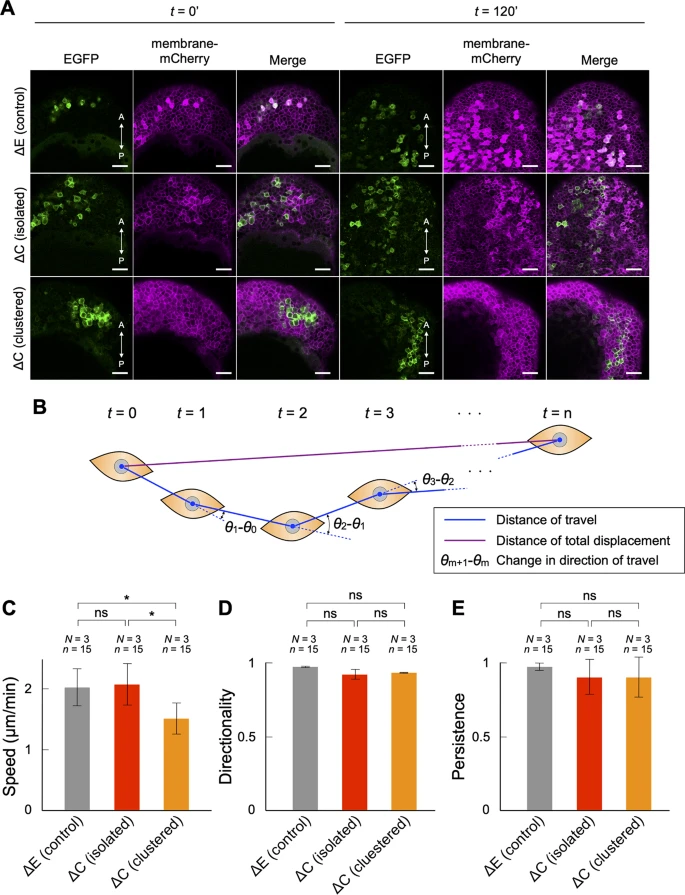
Fig. 3 The speed of cell migration in the developing notochord was reduced in PAPCΔC-expressing cells in a homophilic contact-dependent manner. (A–D) PAPCΔC-EGFP was expressed either in a cell cluster or in a mosaic fashion, and the cell positions were tracked during gastrulation. EGFP-PAPCΔE was used as a control. (A) Representative images of control embryos (ΔE [control]), embryos expressing PAPCΔC-EGFP in a mosaic fashion (ΔC [isolated]) and embryos expressing PAPCΔC-EGFP in a cluster (ΔC [clustered]), at the beginning (t = 0’) and end (t = 120’) of confocal microscopy. Scale bars: 50 μm. (B) A schematic diagram of cell tracking. The distance traveled between timepoints (blue lines), the distance of total displacement (purple line), and the change in direction of travel between timepoints (arcs) were extracted. (C) The speed of cell migration (µm/min) was calculated as the sum of the distance traveled by a cell divided by time. (D) The directionality of cell migration was calculated as the distance of total displacement divided by the sum of the total distance traveled. (E) The persistence of cell migration was calculated by the mean of cosθ, where θ represents the angle of directional change between the timepoints. Fifteen cells (n = 15) from three independent experiments (N = 3) were analyzed. * p < 0.05, ns, not significant (Tukey’s HSD test). The data are presented as the mean ± s.d. values.