
|
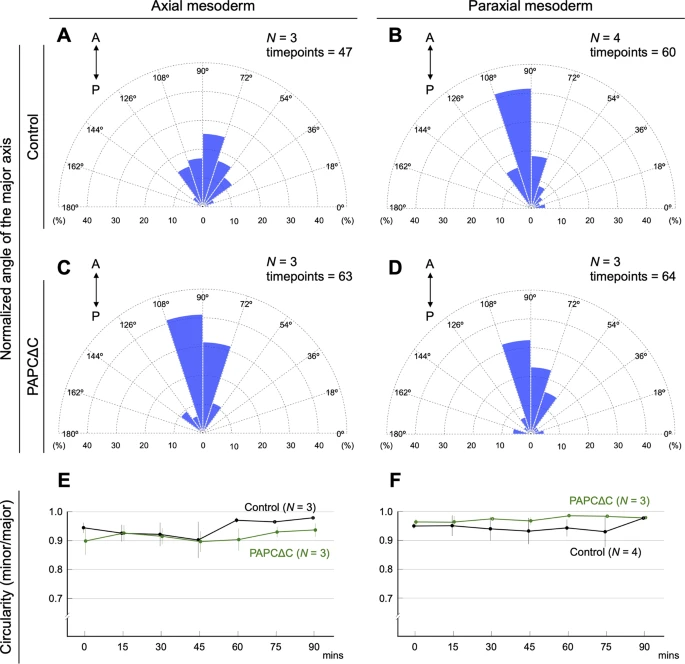
Fig. 6 The expression of PAPCΔC biased the direction of supracellular stress in the developing notochord. (A-D) Distributions of the normalized angle of the major axis of the ellipse are plotted in rose diagrams (see Methods). (A) Axial mesoderm of the control embryos (expressed with membrane-mCherry). (B) Paraxial mesoderm of the control embryos. (C) Axial mesoderm of PAPCΔC-expressing embryos. (D) Paraxial mesoderm of PAPCΔC-expressing embryos. In the axial mesoderm, where endogenous PAPC is suppressed, the distribution of the normalized angle of the major axis was significantly shifted (towards average) by PAPCΔC expression (α < 0.005, Mardia–Watson–Wheeler test) (A, C). In the paraxial mesoderm, where endogenous PAPC is highly expressed, the expression of PAPCΔC had no significant effect on the distribution of the direction of the major axis (0.05 < α < 0.975, Mardia–Watson–Wheeler test) (B, D). The number of embryos analyzed (n) and the timepoints included in the plot are shown in each panel. (E, F) The circularity of the oil droplet (the ratio between the major and minor axes: minor/major) was calculated every 15 min in the axial (E) and paraxial mesoderm (F), with or without PAPCΔC expression. The data are shown in as the mean ± s.d. values.