
- Title
-
Zebrafish reveal new roles for Fam83f in hatching and the DNA damage-mediated autophagic response
- Authors
- Jones, R.A., Cooper, F., Kelly, G., Barry, D., Renshaw, M.J., Sapkota, G., Smith, J.C.
- Source
- Full text @ Open Biol.
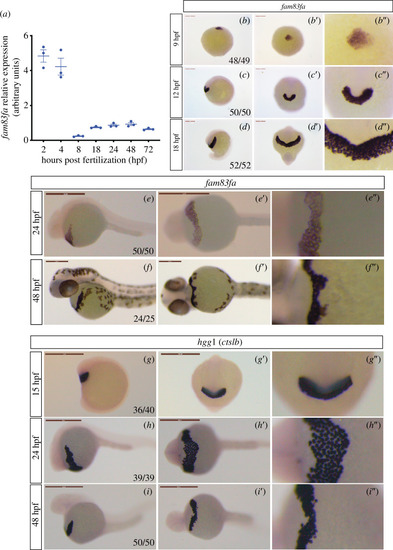
Zebrafish EXPRESSION / LABELING:
|
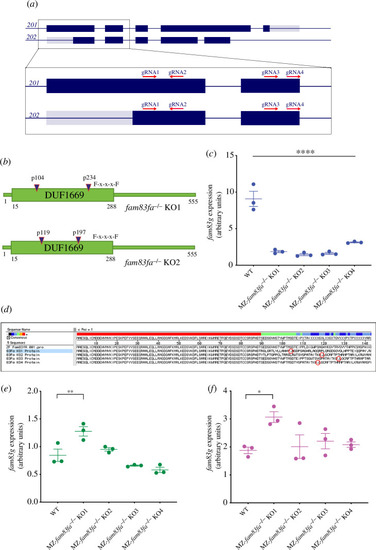
Generation of |
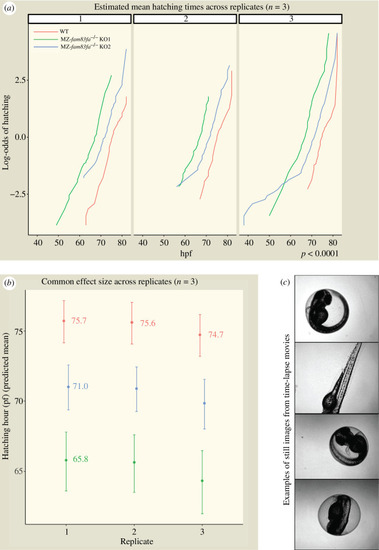
MZ- PHENOTYPE:
|
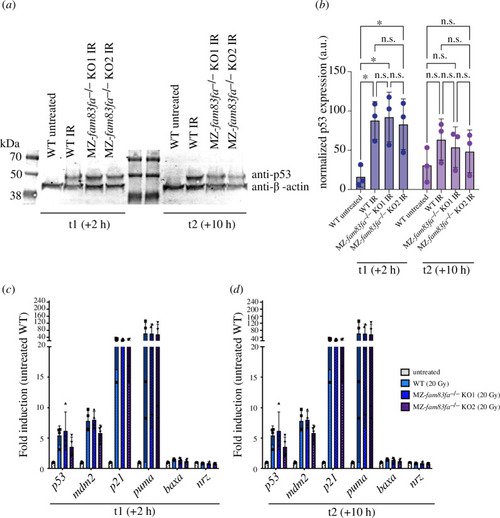
No difference in the p53 response was detected in MZ- |
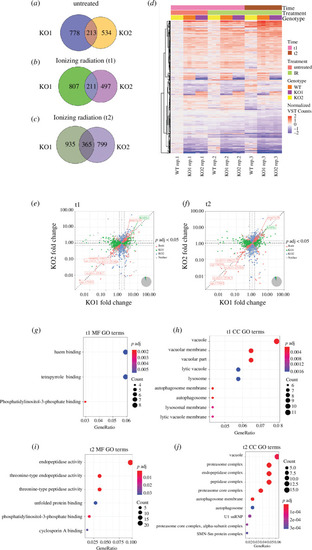
Transcriptomic analysis suggests degradation pathways are impaired in MZ- |

Fam83fa is targeted to the lysosome. ( |