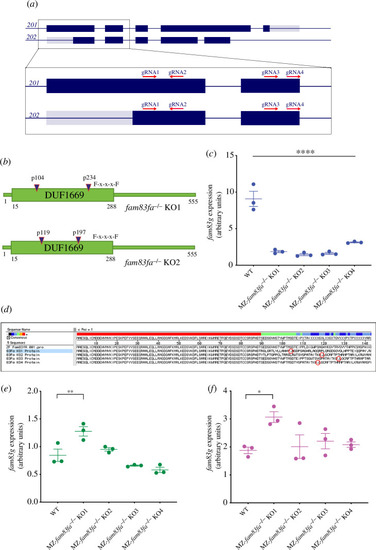
Generation of fam83fa−/− zebrafish lines by CRISPR/Cas9 (a) Schematic representation of fam83fa transcripts 201 and 202 showing CRISPR/Cas9 gRNA targeting regions. Dark blue and grey boxes denote exons and untranslated exonic regions, respectively. Zoomed region shows exons 1 and 2 and the gRNA (1–4) target regions (red arrows). Transcript 201 is the presumed primary transcript; however, all gRNAs were designed to promote complete loss of the DUF1669 domain by introducing indels at the 5’ end of either transcript. (b) Schematic of Fam83fa showing locations of the PTCs induced in the fam83fa-/- KO1 and KO2 lines by combined injection of gRNA1+ gRNA3 (blue triangles). Exons 1 and 2 (a) code for the first 210 aa of Fam83fa, therefore all gRNAs were predicted to induce PTCs in the DUF1669 domain upstream of the F-x-x-x-F sequence motif (for simplicity, only KO1-KO2 are shown). (c) Relative expression of fam83fa in WT and MZ-fam83fa−/− KO1–KO4 homozygous embryos as labelled, normalized to 18S (arbitrary units). Data points represent biological replicates. Error bars = s.e.m. ****p < 0.00005, one-way ANOVA with Tukey’s post-hoc test. (d) In silico translation of the Sanger sequenced qRT-PCR products amplified in (c). PTCs are denoted by red circles. Alignment performed using MegAlign software (DNASTAR). (e) Relative expression of fam83fb in WT and MZ-fam83fa−/− KO1–KO4 homozygous embryos as labelled, normalized to 18S. Error bars = s.e.m. **p < 0.005; *p < 0.05, one-way ANOVA with Tukey’s post-hoc test. Data points represent biological replicates. (f) As (e) except showing relative expression of fam83g.
|
