
- Title
-
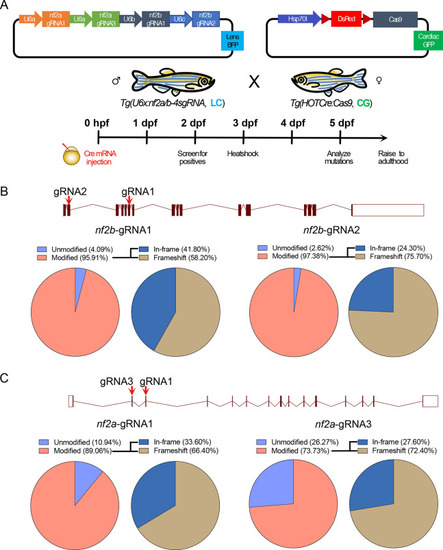
Generation of a zebrafish neurofibromatosis model via inducible knockout of nf2
- Authors
- Desingu Rajan, A.R., Huang, Y., Stundl, J., Chu, K., Irodi, A., Yang, Z., Applegate, B.E., Bronner, M.E.
- Source
- Full text @ Dis. Model. Mech.
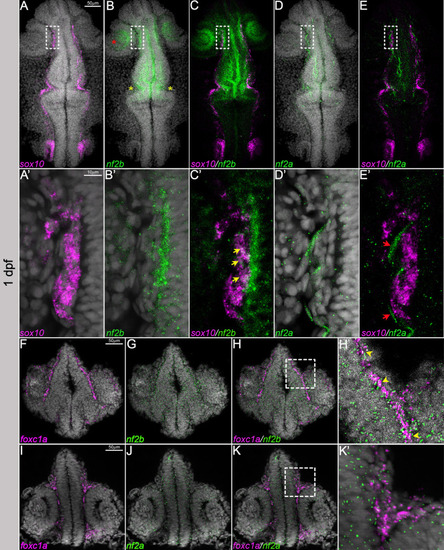
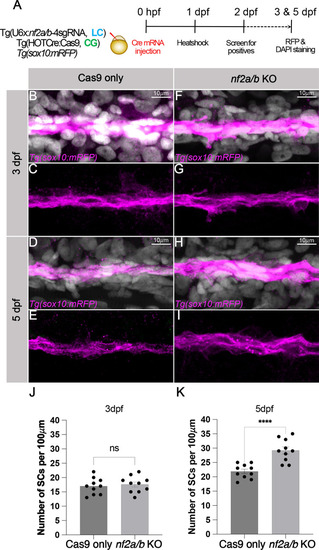
EXPRESSION / LABELING:
|
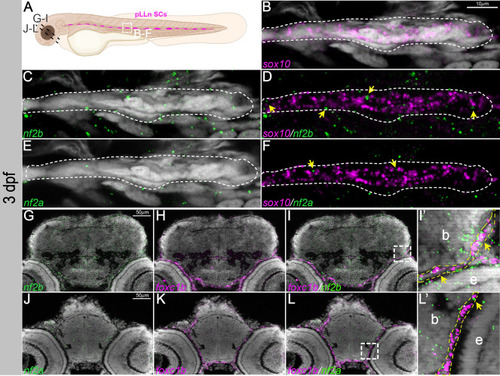
EXPRESSION / LABELING:
|
|
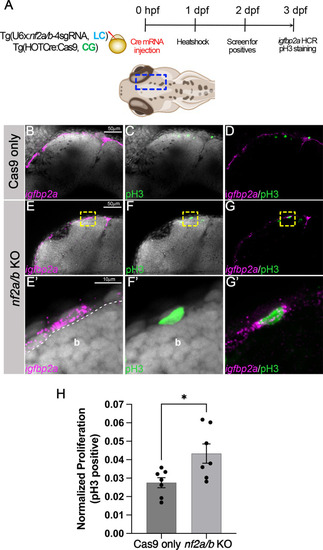
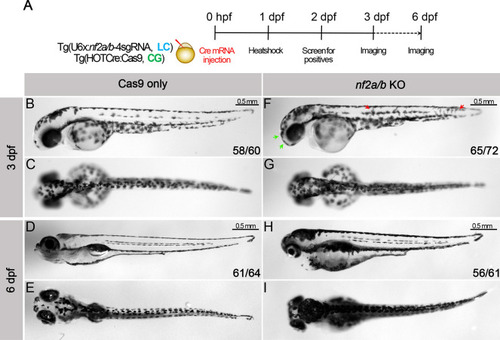
PHENOTYPE:
|
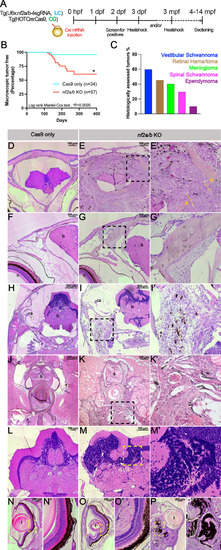
PHENOTYPE:
|
PHENOTYPE:
|
PHENOTYPE:
|