
Fig. 5.
- ID
- ZDB-IMAGE-241218-52
- Publication
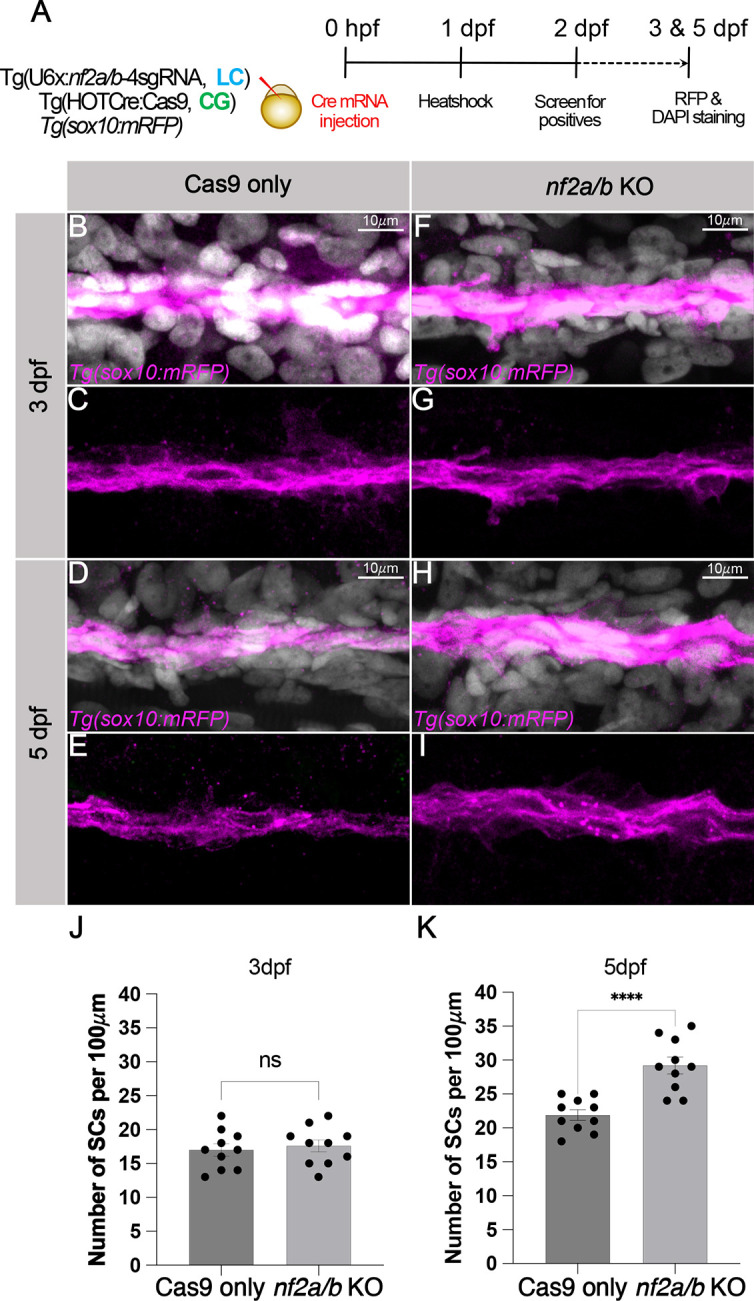
- Desingu Rajan et al., 2024 - Generation of a zebrafish neurofibromatosis model via inducible knockout of nf2
- All Figures
- Figures for Desingu Rajan et al., 2024
|
Fig. 5.