|
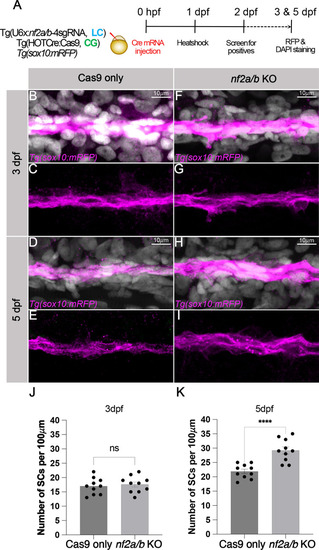
nf2a/b knockout leads to Schwann cell hyperplasia. (A) Schematic representing the experimental strategy. (B-I) Confocal images of the pLLn SCs of Cas9-only controls (B-E) and nf2a/b knockout (F-I) embryos at 3 dpf and 5 dpf. pLLn SCs are labeled by Tg(sox10:mRFP) (magenta) and counterstained by DAPI (gray). Images represent confocal maximum-intensity projections of whole-mount embryos. (J,K) Bar plots showing quantification of the Sox10-positive pLLn SCs at 3 dpf (J) and 5 dpf (K) (ns, not significant; ****P<0.0001; each dot represents data from one larva). Each dataset was compared using unpaired two-tailed Student's t-test in GraphPad Prism. Error bars indicate s.e.m. across n=10 embryos. Each dot represents average of counts from three regions of pLLn SCs per embryo.
|