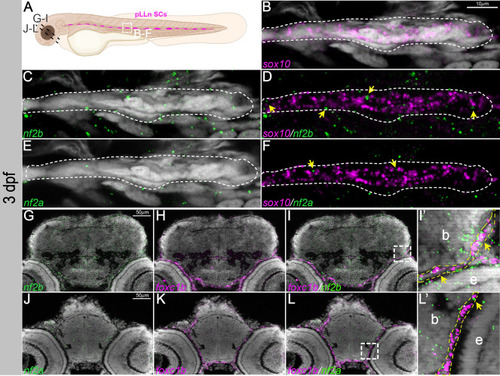
nf2a/b is expressed in Schwann cells and meninges. (A) Schematic representing the posterior lateral line Schwann cells (pLLn SCs; white dashed line box) and sectioned regions (black dashed lines) at 3 dpf. (B-F) Multiplexed fluorescent mRNA in situ hybridizations by HCR on whole-mount embryos reveal expression of nf2b, nf2a and sox10 in a Schwann cell cluster at 3 dpf. Yellow arrows indicate cells that have both sox10 and nf2 expression. White dashed lines indicate pLLn SCs expressing sox10. (G-I,J-L) Multiplexed fluorescent mRNA in situ hybridizations by HCR on cryo-sectioned embryos reveal expression of nf2b, nf2a and foxc1b in the cranial meninges at 3 dpf. (I′,L′) Magnified images of the regions in the white dashed line boxes in I and L, respectively. Yellow dashed lines mark the meninges layer in close proximity to the brain; yellow arrowheads indicate cells that have both foxc1b and nf2 expression. Images are representative of n=7 embryos. Images in B-F represent confocal planes of 5 μm thickness. G-L are histological sections of 12 μm thickness imaged with Apotome. DAPI (gray) was used as a counterstain. b, brain; e, eye.
|
