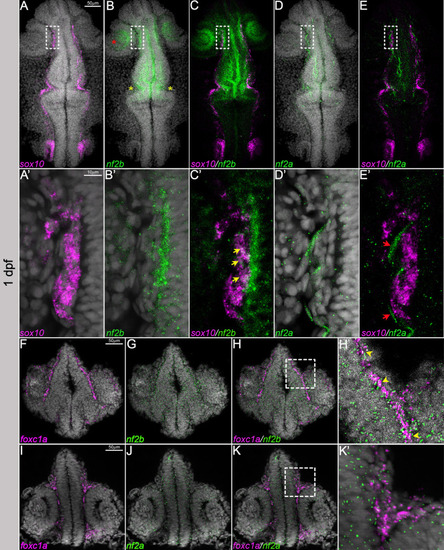
nf2a/b is expressed in the cranial neural crest cells and mesenchyme. (A,B,C,D,E) Multiplexed fluorescent mRNA in situ hybridizations by hybridization chain reaction (HCR) reveal expression of nf2b, nf2a and sox10 in whole-mount embryos at 1 dpf. (A′,B′,C′,D′,E′) Magnified images of the regions in the white dashed line boxes in A, B, C, D and E (yellow arrows indicate overlap of nf2b and sox10 expression; red arrows indicate the ectodermal epithelial cell), (F-H,I-K) nf2b, nf2a and foxc1a in cryo-sectioned embryos at 1 days post fertilization (dpf). (H′,K′) Magnified images of the regions in the white dashed line boxes in H and K, respectively (yellow arrowheads indicate overlap of nf2b and foxc1a expression). Images are representative of n=5 embryos. DAPI (gray) was used as a counterstain. Images in A, B, C, D and E represent maximum-intensity projections of whole-mount embryos and those in A′′, B′, C′, D′ and E′ represent confocal planes of 2.3 μm thickness. F-H and I-K are histological sections of 12 μm thickness imaged with Apotome. Red asterisk indicates the optic cup; yellow asterisks indicate the midbrain–hindbrain border.
|
