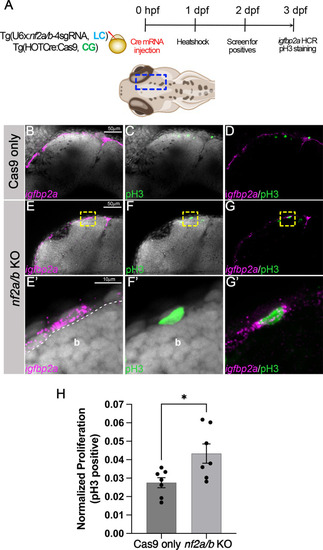
nf2a/b knockout leads to increased meningeal proliferation. (A) Schematic representing the experimental strategy. Blue dashed line box in the 3 dpf zebrafish schematic indicates the imaged region. (B-G) Confocal images of the cranial region of 3 dpf Cas9-only (B-D) and nf2a/b knockout (E,F,G) embryos show the overlap of meningeal marker igfbp2a and proliferation marker pH3. (E′,F′,G′) Yellow dashed line boxes show the magnified region of the overlap in the nf2a/b knockout embryos. (H) Bar plot showing quantification of normalized proliferation (*P=0.0197; each dot represents data from one larva). Normalized proliferation=Igfbp2a and pH3 double-positive cells/total pH3-positive cells in the analyzed region. Each dataset was compared using unpaired two-tailed Student's t-test in GraphPad Prism. Error bars indicate s.e.m. across n=7 embryos. White dashed line marks the boundary between the brain and meninges. Images in B-E, F and G represent maximum-intensity projections of confocal planes in whole-mount embryos. E′, F′ and G′ represent confocal planes of 3.2 μm thickness. DAPI (gray) was used as a counterstain. b, brain; KO, knockout; pH3, phospho-histone 3.
|
