
- Title
-
Emc1 is essential for vision and zebrafish photoreceptor outer segment morphogenesis
- Authors
- McCann, T., Sundaramurthi, H., Walsh, C., Virdi, S., Alvarez, Y., Sapetto-Rebow, B., Collery, R.F., Carter, S.P., Moran, A., Mulholland, R., O'Connor, J.J., Taylor, M.R., Rauch, N., Starostik, M.R., English, M.A., Swaroop, A., Geisler, R., Reynolds, A.L., Kennedy, B.N.
- Source
- Full text @ FASEB J.
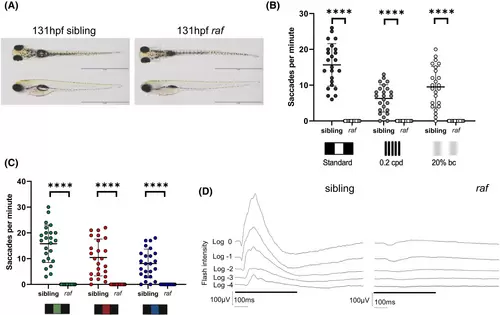
raf is a novel zebrafish model of inherited blindness. (A) Gross morphology of raf mutant larvae and sibling controls at 131 hpf. Mutants lack an inflated swim bladder but have otherwise normal gross morphology. Scale bar = 2 mm. (B) Visual behavior was assessed by different OKR drums; standard, 0.2 cpd (cycles per degree) and 20% black contrast (bc) in < 131 hpf larvae. (C) Visual behavior was assessed by sequential exposure to colored standard OKR drums. N = 3 independent biological replicates with n = 8 larvae per replicate. Error bars indicate the mean ± SD. The midline of the error bars represents the group average. A non-parametric Mann–Whitney U-test was performed where ****p < .0001. (D) Analysis of visual function measured by electroretinogram. The response of the outer retina to a short (500 ms, rectangular black bar) flash of light at 5 increasing intensities of light (0 log = 2.8 × 10³ μW/cm2) was recorded at the corneal surface of 6 dpf zebrafish larvae. n = 5 (sibling), 6 (raf mutants). |
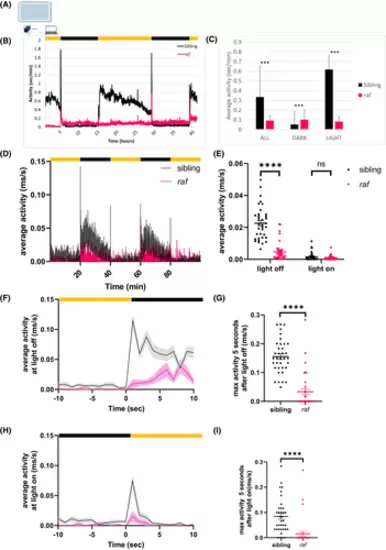
raf zebrafish have visual motor response defects. (A) Schematic representation of the visual motor response (VMR) assay. Larvae are individually plated in wells in a square-bottom 96-well plate before placement in the observation chamber. (B) The normal activity (average seconds activity per minute) of raf mutants (magenta line) and their wild-type siblings (black line) was recorded over 42 h, using the Viewpoint system, from the evening of 4 dpf (6.30 pm) to the morning of 6 dpf (10.30 am). The black bars represent two 10-h night periods. (C) Average activity levels over the entire experiment (all), during the night time (dark) and during the day time (light). Magenta bar = average activity of 55 raf mutants; black bar = average activity of 80 wild type (wt) siblings. Student's t-test, where ***p ≤ .0001 (D) Visual motor response (VMR) activity traces displaying the average activity of sibling (black) and raf mutants (pink) across the entire 100-min experimental paradigm. (E) Dot plot of the average activity of each fish over the combined 40-min light-off period and 40-min light-on period. Mann–Whitney test; p < .0001 for light off, nsp = .7859 for light on. (F and H) Activity traces displaying the average activity of the larvae 10 s before and after the light turned off (F) or turned on (H). The average is represented by the line and the SEM shown by the shaded gray or pink. (G and I) Dot plots of the max activity of each fish within 5 s of the light off (G) or light on (I). Mann–Whitney test: ****p < .0001. Yellow and black bars represent 20-min periods of lights on and off, respectively. N = 3 independent biological replicates with n = 12 larvae per replicate. Error bars are the mean ± SEM. |
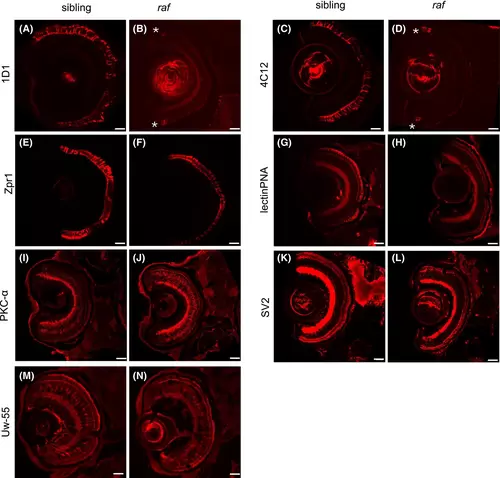
raf zebrafish have reduced outer retinal markers but inner retinal markers are not changed. (A–N): Images of retinal cross sections from wild-type siblings (A, C, E, G, I, K, and M) and raf−/− (B, D, F, H, J, L, and N) stained with antibodies to retinal cell populations (red); 1D1 (A and B), 4C12 (C and D), Zpr1 (E and F), lectin PNA (G and H), PKC-α (I and J), SV2 (K and L), and Uw-55 (M and N). Asterisks show faint 1D1/4C12 staining in the peripheral retina in raf−/− mutant images. Sections were generated with cryostat and imaged with a confocal microscope with 40x objective (A–N). Larvae were 6 dpf (A-L) and 4 dpf (M and N). Scale bar = 20 μm (A–N). |

Histology and morphometric analysis of raf−/− eyes reveal a range of ocular and retinal layer defects. (A and B) Representative retinal cross sections stained with toluidine blue of sibling (A and A') and raf−/− (B and B'). Sections were generated using an ultramicrotome and imaged with a 40x objective using a light microscope. (A′ and B′) shows the area from the white box in A-B with the different retinal layers labeled (A′ and B′). GCL, ganglion cell layer; IPL, inner plexiform layer; INL, inner nuclear layer; OPL, outer plexiform layer; PR, photoreceptor; RPE, retinal pigment epithelium. In A and B, red dashed circles surround single hyaloid vessels. In B, the purple arrow points to the gap anterior to the lens, and the green arrows point to the gap posterior to the lens. In A″ and B″ the vacuoles are marked with orange arrows. Scale bar = 50 μm. (C) Dot plots show the thickness of the lens and retinal cell layers. Unpaired t-test corrected for multiple comparisons with Bonferroni–Dunn method. IPL: *p = .0211, PR: **p = .0090. Data are mean ± SEM. (D) Dot plot shows the area of gaps around the lens. Unpaired t-test, ****p < .0001, **p = .004. (E) Dot plot shows the total number of vacuoles in the PR layer observed in each section. Data is mean ± SEM. n = 5 larvae per genotype. Morphometric analyses were performed using Image J. (F and G) Representative transmission electron micrographs from retinal cross sections from siblings and raf−/− at 6 dpf. Both central (F) and peripheral (G) regions of the retina are shown. Yellow dotted line marks the outline of outer segments. |
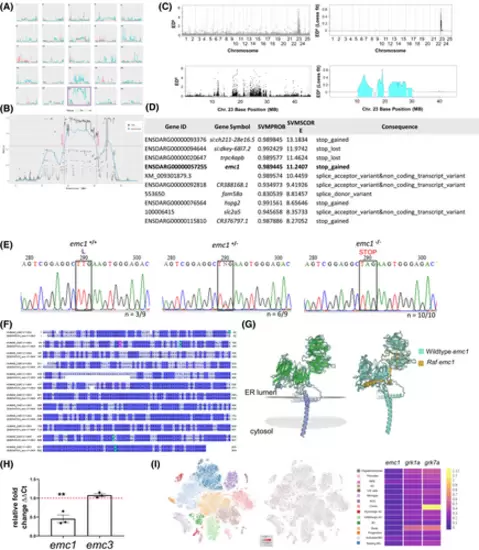
emc1 was identified as the gene mutated in raf−/− zebrafish. (A) Traces of sibling (peach) and raf−/− (blue) for each chromosome from whole genome sequencing. Purple box highlights chromosome 23. (B) Trace showing the positions along chromosome 23. (C) raf−/− mutation mapping from RNA sequencing. Graphs depict the Euclidean distance scores raised to sixth power across the genome and across chromosome 23. The vertical gray lines delineate chromosome edges and chromosome widths represent the relative number of SNPs on the chromosome. Loess fit curve was calculated using the data. (D) Table showing raf−/− gene candidates and types of mutations observed. (E) Sanger sequencing traces from wild-type siblings, heterozygous siblings, and homozygous raf−/−mutants. Black box highlights the leucine codon that is mutated to become a stop codon due to the single nucleotide change. Heterozygous animals can be identified by the presence of the double AT peak (N). (F) Multiple sequence alignment of human EMC1 compared with zebrafish Emc1. Alignment was generated using ClustalW. Colors represent percentage identity and were annotated using Jalview. The mutation point in raf−/−is marked by purple. (G) The predicted 3D structures of zebrafish wild type and mutant Emc1 were generated with Swiss Model software (https://swissmodel.expasy.org/) using A0A671TKS0.1.A as a template. Left-Colors represent secondary structures with beta sheets (green) and alpha helices (purple). Gray marks the predicted transmembrane portion. The right colors represent the different proteins wild-type Emc1 (cyan) and raf Emc1 (gold). (H) emc1 and emc3 transcript expression levels in raf−/−mutants measured by qPCR from pooled RNA extracted from whole zebrafish larvae at 5 dpf. Levels were normalized by β-actin expression. Red line is the level of expression of siblings. Three replicates of 20 larvae. Unpaired t-test, **p = .0056, nsp = .11. (I) Expression of emc1 in the zebrafish retina from online scRNA-seq data https://proteinpaint.stjude.org/F/2019.retina.scRNA.html. Red marks cells with emc1 expression. Heat map displays the mean expression of emc1, grk1a, and grk7a in each cell type. |
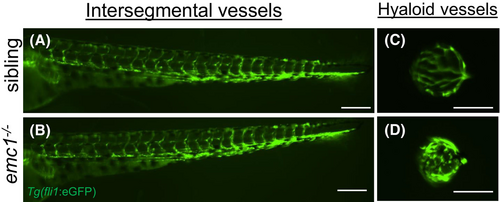
Hyaloid vessels are dysregulated in emc1−/− zebrafish. (A and B): Fluorescent images displaying lateral views of the trunk of wild-type sibling (A) and emc1−/− (B) larvae at 5 dpf carrying the Tg(fli1:GFP) transgene (green). Scale bar is 200 μm. (C and D): Fluorescent images displaying lateral views of dissected lenses from wild-type siblings (C) and emc1−/− (D) larvae at 5 dpf carrying the Tg(fli1:GFP) transgene (green) to image the hyaloid vessels. Scale bar is 50 μm. |
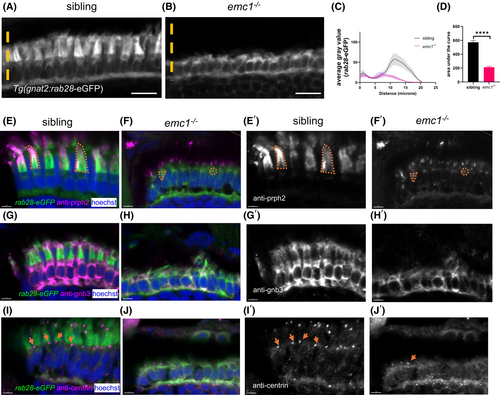
Emc1−/− display defective expression and localization of outer segment proteins. (A and B) Retinal cross sections of Tg(gnat2:Rab28-eGFP) transgenic larvae. Orange line represents how the gray value was measured. (C) Graph shows the average gray value of the GFP fluorescence of sibling (black) and emc1−/− (pink) along the line. Data is mean ± SEM. 10 cells per larvae were measured. Three replicates of 9–10 larvae per genotype. (D) Box plot shows the area under the curve of the average gray value. Unpaired t-test, ****p < .0001. (E–J) Retinal cross sections of siblings and emc1−/− carrying the transgene Tg(gnat2:Rab28-eGFP) (green) labeled with anti-Prph2 (E and F), anti-Gnb3(G and H), anti-centrin (I and J) (magenta), and Hoechst (blue). (E′–J′) Shows E and J images with the anti-Prph2, Gnb3, and centrin labeling only (white). In E–F′ orange marks the region covered by the Prph2 labeling in two cells. In I–J′ orange arrows point to the centrin labeled puncta. Scale bar = 10 μm (A) and 4 μm (E–J′). |
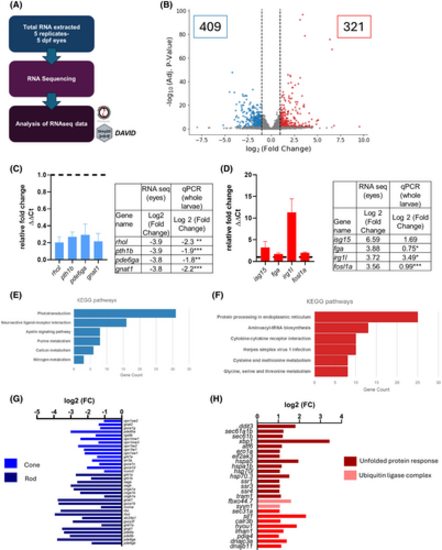
RNA sequencing in emc1−/− eyes reveals that the expression of phototransduction genes is reduced. (A) Schematic of RNA sequencing workflow. Total of 40 larvae per sample/genotype: 80 eyes per sample/tube. RNA sequencing was performed in NEI/NIH on Illumina 2500 and analyzed with RNAlysis. Pathway analysis was performed with ShinyGo/DAVID. (B) Volcano plot displaying the genes that are differentially expressed; downregulated (blue) and upregulated (red) in raf versus siblings. (C and D) Expression levels of selected downregulated (C) and upregulated (D) genes measured by qPCR in emc1−/− compared to siblings from pooled RNA extracted from whole zebrafish larvae. Levels were normalized by β-actin expression. Black line represents the expression of the sibling. Data are mean ± SEM. Three replicates of 20 larvae. Unpaired t-test, *p < .05,**p < .01, ***p < .001. Tables show the genes from the downregulated/ upregulated gene list with the calculated log 2-fold change from the RNA seq compared to values from the qPCR. (E and F) Bar graphs show the top KEGG Pathways associated with the downregulated (E) and upregulated (F) genes. The number of genes that were mapped to each pathway is shown. (G and H) Bar graphs show the transcripts identified by RNAseq (log fold change <−1 or >1) for phototransduction (G) and protein processing in the endoplasmic reticulum (H). Genes are color-coded to group different cell types or parts of the pathway. |