
Fig. 7
- ID
- ZDB-FIG-241016-7
- Publication
- McCann et al., 2024 - Emc1 is essential for vision and zebrafish photoreceptor outer segment morphogenesis
- Other Figures
- All Figure Page
- Back to All Figure Page
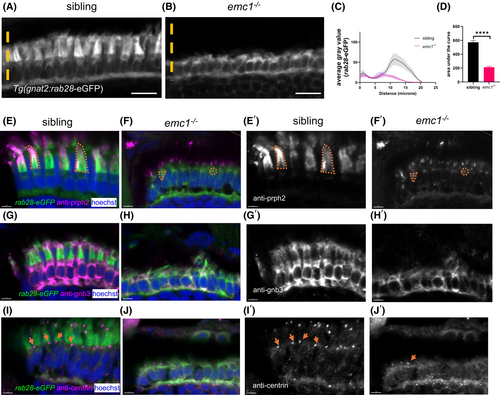
Emc1−/− display defective expression and localization of outer segment proteins. (A and B) Retinal cross sections of Tg(gnat2:Rab28-eGFP) transgenic larvae. Orange line represents how the gray value was measured. (C) Graph shows the average gray value of the GFP fluorescence of sibling (black) and emc1−/− (pink) along the line. Data is mean ± SEM. 10 cells per larvae were measured. Three replicates of 9–10 larvae per genotype. (D) Box plot shows the area under the curve of the average gray value. Unpaired t-test, ****p < .0001. (E–J) Retinal cross sections of siblings and emc1−/− carrying the transgene Tg(gnat2:Rab28-eGFP) (green) labeled with anti-Prph2 (E and F), anti-Gnb3(G and H), anti-centrin (I and J) (magenta), and Hoechst (blue). (E′–J′) Shows E and J images with the anti-Prph2, Gnb3, and centrin labeling only (white). In E–F′ orange marks the region covered by the Prph2 labeling in two cells. In I–J′ orange arrows point to the centrin labeled puncta. Scale bar = 10 μm (A) and 4 μm (E–J′). |