
Fig. 5
- ID
- ZDB-IMAGE-241016-5
- Publication
- McCann et al., 2024 - Emc1 is essential for vision and zebrafish photoreceptor outer segment morphogenesis
- All Figures
- Figures for McCann et al., 2024
|
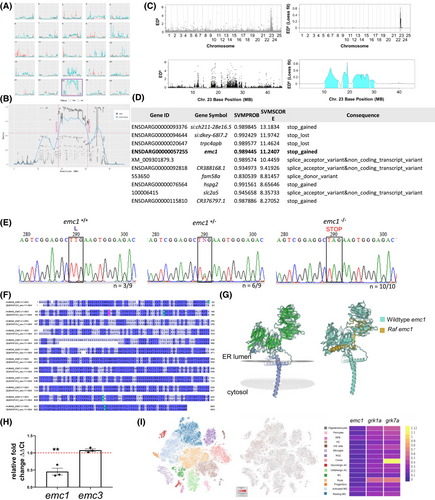
Fig. 5 emc1 was identified as the gene mutated in raf−/− zebrafish. (A) Traces of sibling (peach) and raf−/− (blue) for each chromosome from whole genome sequencing. Purple box highlights chromosome 23. (B) Trace showing the positions along chromosome 23. (C) raf−/− mutation mapping from RNA sequencing. Graphs depict the Euclidean distance scores raised to sixth power across the genome and across chromosome 23. The vertical gray lines delineate chromosome edges and chromosome widths represent the relative number of SNPs on the chromosome. Loess fit curve was calculated using the data. (D) Table showing raf−/− gene candidates and types of mutations observed. (E) Sanger sequencing traces from wild-type siblings, heterozygous siblings, and homozygous raf−/−mutants. Black box highlights the leucine codon that is mutated to become a stop codon due to the single nucleotide change. Heterozygous animals can be identified by the presence of the double AT peak (N). (F) Multiple sequence alignment of human EMC1 compared with zebrafish Emc1. Alignment was generated using ClustalW. Colors represent percentage identity and were annotated using Jalview. The mutation point in raf−/−is marked by purple. (G) The predicted 3D structures of zebrafish wild type and mutant Emc1 were generated with Swiss Model software (https://swissmodel.expasy.org/) using A0A671TKS0.1.A as a template. Left-Colors represent secondary structures with beta sheets (green) and alpha helices (purple). Gray marks the predicted transmembrane portion. The right colors represent the different proteins wild-type Emc1 (cyan) and raf Emc1 (gold). (H) emc1 and emc3 transcript expression levels in raf−/−mutants measured by qPCR from pooled RNA extracted from whole zebrafish larvae at 5 dpf. Levels were normalized by β-actin expression. Red line is the level of expression of siblings. Three replicates of 20 larvae. Unpaired t-test, **p = .0056, nsp = .11. (I) Expression of emc1 in the zebrafish retina from online scRNA-seq data https://proteinpaint.stjude.org/F/2019.retina.scRNA.html. Red marks cells with emc1 expression. Heat map displays the mean expression of emc1, grk1a, and grk7a in each cell type.