
Fig. 8
- ID
- ZDB-FIG-241016-8
- Publication
- McCann et al., 2024 - Emc1 is essential for vision and zebrafish photoreceptor outer segment morphogenesis
- Other Figures
- All Figure Page
- Back to All Figure Page
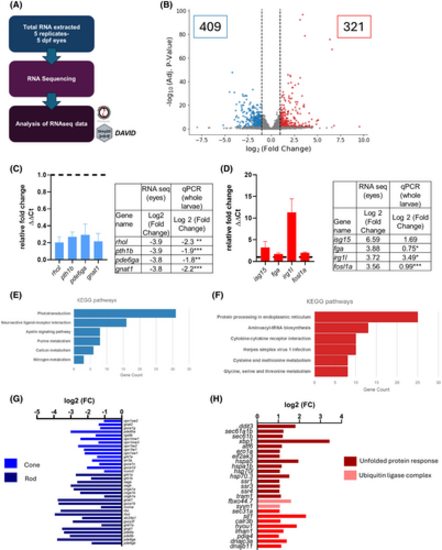
RNA sequencing in emc1−/− eyes reveals that the expression of phototransduction genes is reduced. (A) Schematic of RNA sequencing workflow. Total of 40 larvae per sample/genotype: 80 eyes per sample/tube. RNA sequencing was performed in NEI/NIH on Illumina 2500 and analyzed with RNAlysis. Pathway analysis was performed with ShinyGo/DAVID. (B) Volcano plot displaying the genes that are differentially expressed; downregulated (blue) and upregulated (red) in raf versus siblings. (C and D) Expression levels of selected downregulated (C) and upregulated (D) genes measured by qPCR in emc1−/− compared to siblings from pooled RNA extracted from whole zebrafish larvae. Levels were normalized by β-actin expression. Black line represents the expression of the sibling. Data are mean ± SEM. Three replicates of 20 larvae. Unpaired t-test, *p < .05,**p < .01, ***p < .001. Tables show the genes from the downregulated/ upregulated gene list with the calculated log 2-fold change from the RNA seq compared to values from the qPCR. (E and F) Bar graphs show the top KEGG Pathways associated with the downregulated (E) and upregulated (F) genes. The number of genes that were mapped to each pathway is shown. (G and H) Bar graphs show the transcripts identified by RNAseq (log fold change <−1 or >1) for phototransduction (G) and protein processing in the endoplasmic reticulum (H). Genes are color-coded to group different cell types or parts of the pathway. |