
Fig. 4
- ID
- ZDB-IMAGE-241016-4
- Publication
- McCann et al., 2024 - Emc1 is essential for vision and zebrafish photoreceptor outer segment morphogenesis
- All Figures
- Figures for McCann et al., 2024
|
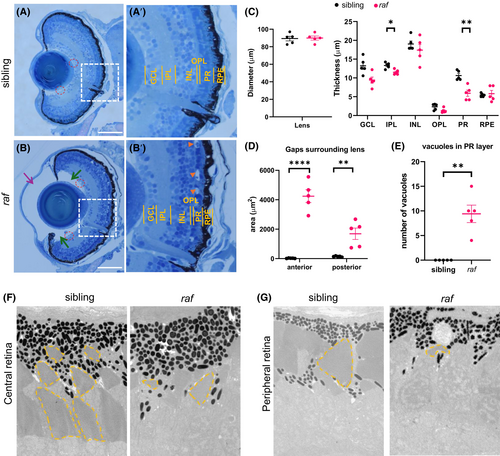
Fig. 4 Histology and morphometric analysis of raf−/− eyes reveal a range of ocular and retinal layer defects. (A and B) Representative retinal cross sections stained with toluidine blue of sibling (A and A') and raf−/− (B and B'). Sections were generated using an ultramicrotome and imaged with a 40x objective using a light microscope. (A′ and B′) shows the area from the white box in A-B with the different retinal layers labeled (A′ and B′). GCL, ganglion cell layer; IPL, inner plexiform layer; INL, inner nuclear layer; OPL, outer plexiform layer; PR, photoreceptor; RPE, retinal pigment epithelium. In A and B, red dashed circles surround single hyaloid vessels. In B, the purple arrow points to the gap anterior to the lens, and the green arrows point to the gap posterior to the lens. In A″ and B″ the vacuoles are marked with orange arrows. Scale bar = 50 μm. (C) Dot plots show the thickness of the lens and retinal cell layers. Unpaired t-test corrected for multiple comparisons with Bonferroni–Dunn method. IPL: *p = .0211, PR: **p = .0090. Data are mean ± SEM. (D) Dot plot shows the area of gaps around the lens. Unpaired t-test, ****p < .0001, **p = .004. (E) Dot plot shows the total number of vacuoles in the PR layer observed in each section. Data is mean ± SEM. n = 5 larvae per genotype. Morphometric analyses were performed using Image J. (F and G) Representative transmission electron micrographs from retinal cross sections from siblings and raf−/− at 6 dpf. Both central (F) and peripheral (G) regions of the retina are shown. Yellow dotted line marks the outline of outer segments.