
Fig. 2
- ID
- ZDB-FIG-241016-2
- Publication
- McCann et al., 2024 - Emc1 is essential for vision and zebrafish photoreceptor outer segment morphogenesis
- Other Figures
- All Figure Page
- Back to All Figure Page
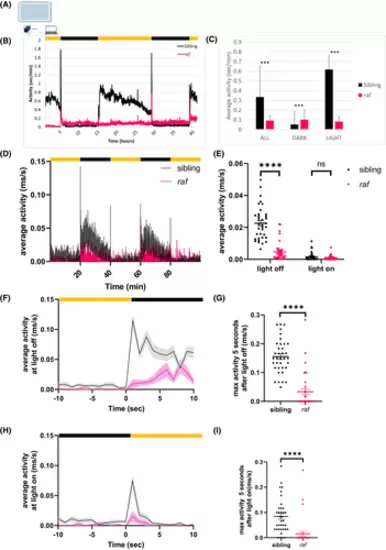
raf zebrafish have visual motor response defects. (A) Schematic representation of the visual motor response (VMR) assay. Larvae are individually plated in wells in a square-bottom 96-well plate before placement in the observation chamber. (B) The normal activity (average seconds activity per minute) of raf mutants (magenta line) and their wild-type siblings (black line) was recorded over 42 h, using the Viewpoint system, from the evening of 4 dpf (6.30 pm) to the morning of 6 dpf (10.30 am). The black bars represent two 10-h night periods. (C) Average activity levels over the entire experiment (all), during the night time (dark) and during the day time (light). Magenta bar = average activity of 55 raf mutants; black bar = average activity of 80 wild type (wt) siblings. Student's t-test, where ***p ≤ .0001 (D) Visual motor response (VMR) activity traces displaying the average activity of sibling (black) and raf mutants (pink) across the entire 100-min experimental paradigm. (E) Dot plot of the average activity of each fish over the combined 40-min light-off period and 40-min light-on period. Mann–Whitney test; p < .0001 for light off, nsp = .7859 for light on. (F and H) Activity traces displaying the average activity of the larvae 10 s before and after the light turned off (F) or turned on (H). The average is represented by the line and the SEM shown by the shaded gray or pink. (G and I) Dot plots of the max activity of each fish within 5 s of the light off (G) or light on (I). Mann–Whitney test: ****p < .0001. Yellow and black bars represent 20-min periods of lights on and off, respectively. N = 3 independent biological replicates with n = 12 larvae per replicate. Error bars are the mean ± SEM. |