FIGURE SUMMARY
Title

The oncogenic ADAMTS1-VCAN-EGFR cyclic axis drives anoikis resistance and invasion in renal cell carcinoma

Authors
Wen, Y.C., Lin, Y.W., Ho, K.H., Yang, Y.C., Lai, F.R., Chu, C.Y., Chen, J.Q., Lee, W.J., Chien, M.H.
Source
Full text @ Cell Mol. Biol. Lett.

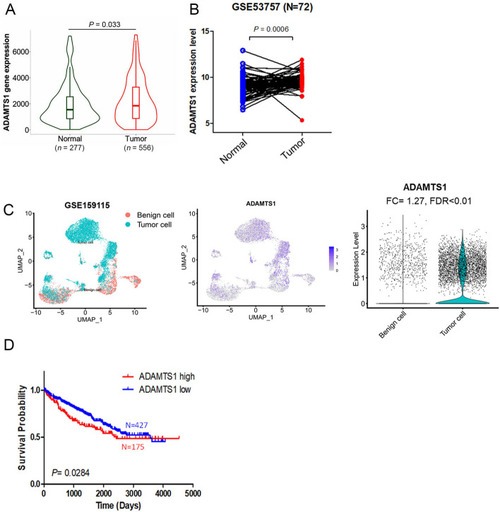
Elevated ADAMTS1 expression in renal cell carcinoma (RCC) tissues is associated with a poor prognosis. A ADAMTS1 mRNA levels in RCC tissues were significantly higher than those in normal renal tissues (p = 0.033) as determined by TNMplot (https://tnmplot.com/analysis/). B ADAMTS1 expression was assessed in 72 matched clear cell (cc)RCC tissues and their corresponding normal tissues using data from the GSE53757 ccRCC expression microarray dataset. C The left panel of the Uniform Manifold Approximation and Projection (UMAP) plot illustrates the distribution of tumor cells and benign epithelial cells based on single-cell RNA sequencing (scRNA-seq) profiles. The UMAP plot in the middle panel shows the expression distribution of ADAMTS1. The violin plot in right panel indicates that ADAMTS1 exhibits a significant elevation in tumor cells compared with benign epithelial cells, with a fold change (FC) of 1.27 and a false discovery rate (FDR) of less than 0.01. D Kaplan–Meier analysis depicts overall survival (OS) rates in patients with ccRCC based on high or low ADAMTS1 expression using data from TCGA

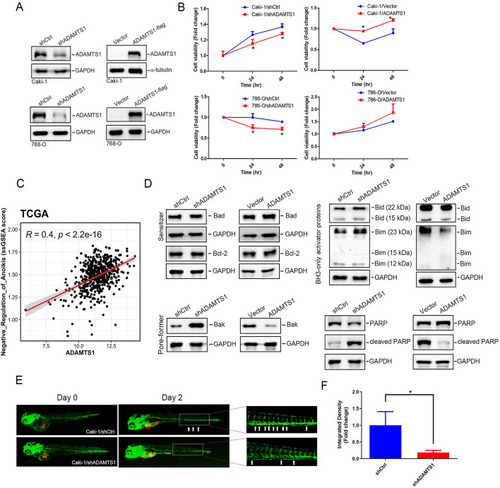
ADAMTS1 expression promotes anoikis resistance of renal cell carcinoma (RCC) via inhibiting Bid, Bim, and Bak. A A western blot analysis was conducted to assess ADAMTS1 expression in Caki-1 and 786-O cells following transduction with either ADAMTS1 short hairpin (sh)RNA (left) or an ADAMTS1-expressing vector (right). B Cell viability of suspended Caki-1 and 786-O cells was evaluated using a CCK8 assay at 24 and 48 h post-stable overexpression (right) or knockdown (left) of ADAMTS1. Data are presented as the mean ± SD of three independent experiments. * p < 0.05, compared with the control group. C Dot plot demonstrated the correlation between the single sample gene set enrichment analysis (ssGSEA) score of “negative regulation of anoikis” and ADAMTS1 expression in TCGA-KIRC patients. A Pearson correlation was performed to evaluate their association and significance. D Western blot analysis of intrinsic apoptosis-related proteins (Bad, Bcl-2, Bak, Bid, Bim, and PARP) in suspended Caki-1 cells manipulated with ADAMTS1. GAPDH served as a loading control. E and F Dissemination of RCC cells in zebrafish embryos. Caki-1 cells with ADAMTS1-knockdown were implanted into zebrafish embryos at 48 h post fertilization. Tumor cell dissemination was observed at 2 days post injection (dpi), with disseminated tumor foci indicated by white arrowheads on the trunk and end-tail (E). Integrated densities of Caki-1 metastatic tumor cells in the zebrafish trunk and end-tail at 2 dpi were quantified, with the mean value of the integrated density in the shCtl group set to onefold (F)

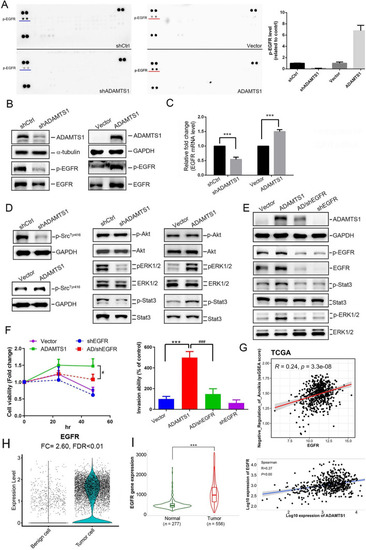
ADAMTS1 expression activates epidermal growth factor receptor (EGFR) signaling cascades to promote anoikis resistance of and invasion by Caki-1 renal cell carcinoma (RCC) cells. A Differential expression levels of phosphorylated receptor tyrosine kinases (RTKs) in cell lysates from AMAMTS1-manipulated Caki-1. An antibody array (R&D Systems) was used to detect 49 different phosphorylated human RTKs. The left panel shows representative array blots at a short exposure time (30 s). The right panel shows a quantitative analysis of phosphorylated (p)-EGFR using a densitometer. Values are presented as the mean ± SD. n = 2. BD Caki-1 cells were subjected to knockdown or overexpression of ADAMTS1 to assess protein levels of p-EGFR and EGFR (B), as well as their downstream signaling cascades (D), using western blotting. Additionally, mRNA levels of the EGFR were analyzed using a real-time qPCR (C). (E and F) EGFR shRNA was transfected into ADAMTS1-overexpressing Caki-1 cells as indicated, and cell lysates were collected to detect expressions or phosphorylation of ADAMTS1, EGFR, ERK, and Stat3 (E). Additionally, cell viability in suspended conditions (F, left) and the cell invasive ability (F, right) were respectively evaluated by CCK8 and Matrigel invasion assays. Multiples of differences are presented as the mean ± SD of three independent experiments. ***p < 0.001, compared with the control group; #p < 0.05, ###p < 0.001, compared with the ADAMTS1-overexpressing only group. (G) Dot plot demonstrated the correlation between the single sample gene set enrichment analysis (ssGSEA) score of “negative regulation of anoikis” and EGFR expression in TCGA-KIRC patients. A Pearson correlation was performed to evaluate their association and significance. (H) The violin plot indicates that EGFR expression is significantly higher in tumor cells compared with benign epithelial cells, with a fold change (FC) of 2.60 and a false discovery rate (FDR) of less than 0.01. (I) Left: EGFR mRNA levels in RCC tissues were significantly higher than those in normal renal tissues (p < 0.001). Right: a positive correlation between ADAMTS1 and EGFR expression in RCC tissues. The kidney cancer dataset was retrieved from the TNMplot database.

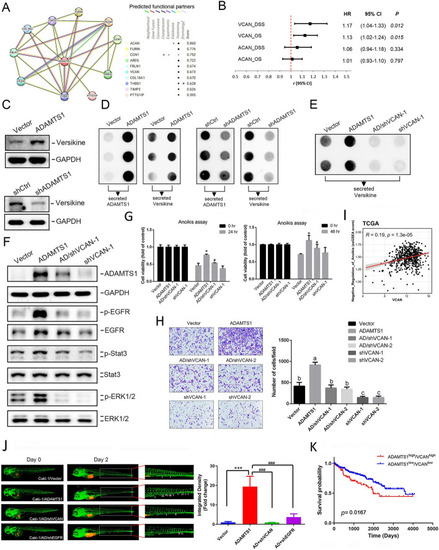
Versican (VCAN) cleavage is critical for ADAMTS1-mediated epidermal growth factor receptor (EGFR) activation, anoikis resistance, invasion, and metastasis of renal cell carcinoma (RCC) cells. A ADAMTS1 protein–protein interaction network of ten differentially expressed genes from the STRING database. B The forest plot illustrates hazard ratios (HRs) and 95% confidence intervals, examining the correlation between candidate genes [ACAN (aggrecan) and VCAN] and overall or disease-specific survival in patients with RCC. C and D Western blot and dot plot analyses respectively revealed levels of cleaved VCAN (versikine) (C) and secretion of ADAMTS1 and versikine (D) in ADAMTS1-manipulated Caki-1 cells. (E and F) Transfection of VCAN-specific shRNA into ADAMTS1-overexpressing Caki-1 cells led to the collection of conditioned media and cell lysates for detecting secreted versikine (E) and the expressions or phosphorylation of ADAMTS1, EGFR, ERK, and Stat3 (F). (I) Dot plot demonstrated the correlation between the single sample gene set enrichment analysis (ssGSEA) score of “negative regulation of anoikis” and VCAN expression in TCGA-KIRC patients. A Pearson correlation was performed to evaluate their association and significance. G, H, J Cell viability (G), cell invasive ability (H), and in vivo metastatic potential (J) of Caki-1 cells expressing VCAN or EGFR shRNA with or without coexpression of ADAMTS1-flag were respectively assessed under suspended conditions with a CCK8 assay, Matrigel invasion assay, and zebrafish xenograft model. Values are presented as the mean ± SD of three independent experiments. In G and J, statistical analysis was performed using Student’s t-test. *p < 0.05, ***p < 0.001, compared with the control group; #p < 0.05, ###p < 0.001, compared with the ADAMTS1-overexpressing only group. In H, data were analyzed using a one-way analysis of variance. Different letters represent various levels of significance. (K) High expression levels of both the ADAMTS1 and VCAN genes were associated with the poorest overall survival in patients with RCC. The p value reflects a comparison between ADAMTS1high/VCANhigh and ADAMTS1low/VCANlow. The RCC dataset was obtained from TCGA

The metalloproteinase activity of ADAMTS1 is pivotal in stimulating the secretion of cleaved versican, activating the epidermal growth factor receptor (EGFR), promoting invasion, and conferring anoikis resistance in renal cell carcinoma (RCC) cells. A A schematic representation depicting two variants of the recombinant ADAMTS1 protein: one containing the metalloproteinase domain (ZnMc) and the other lacking it (TSP), along with a mutant ADAMTS1 expression construct (E402Q). BE Treatment of Caki-1 cells with or without the recombinant ZnMc or TSP protein (40 nM) for 24 or 48 h. Subsequently, secretion of cleaved versican, activation of EGFR signal cascades, invasive abilities, and anoikis were respectively assessed using dot blot (B), western blotting (C), Matrigel invasion (D), and CCK8 assays. FI Cleaved versican secretion (F), EGFR activation (G), invasive abilities (H), and anoikis (I) were evaluated in Caki-1 and 786-O cells after transducing wild-type (WT) ADAMTS1, ADAMTS1/E402Q, or a control vector. In D, E, H, and I, values are presented as the mean ± SD of three independent experiments. *p < 0.05, **p < 0.01, ***p < 0.001, compared with the control group; #p < 0.05, ###p < 0.001, compared with the WT ADAMTS1-overexpressing group

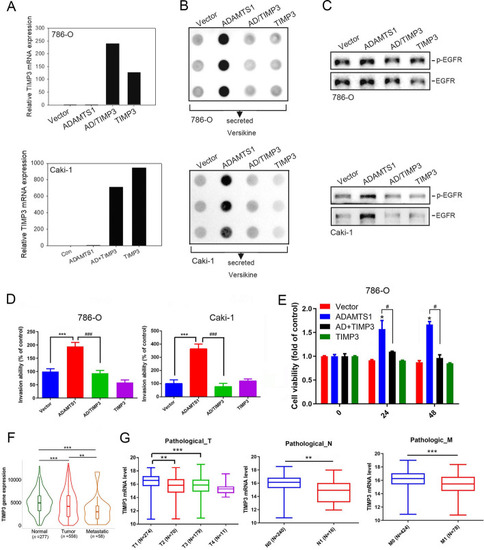
Tissue inhibitor of metalloproteinase 3 (TIMP3) expression reverses ADAMTS1-induced versican cleavage, epidermal growth factor receptor (EGFR) activation, and invasion and anoikis resistance of renal cell carcinoma (RCC) cells. A The pcDNA3-TIMP3 plasmid was transfected into ADAMTS1-overexpressing Caki-1 and 786-O cells as indicated, followed by measurement of TIMP3 mRNA levels using an RT–qPCR. Quantitative results of TIMP3 mRNA levels were normalized to GAPDH mRNA levels. BE Evaluation of cleaved versican secretion B, EGFR activation C, invasive abilities D, and anoikis (E in RCC cells overexpressing ADAMTS1, subsequent to transfection with either a vector control or TIMP3 plasmid. In D and E, the values are presented as the mean ± SD of three independent experiments. *p < 0.05, ***p < 0.001, compared with the vector control group; #p < 0.05, ###p < 0.001, compared with the ADAMTS1-overexpressing group. F Comparative analysis of TIMP3 mRNA levels among normal renal tissues, primary RCC, and metastatic RCC as determined by TNMplot. G Examination of TIMP3 gene expression levels in RCC from TCGA based on the pathological tumor (T), node (N), and metastasis (M) stages

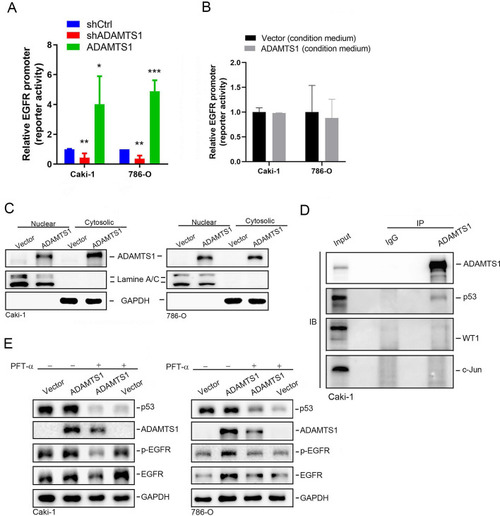
ADAMTS1 is associated with p53 to modulate epidermal growth factor receptor (EGFR) promoter activity and expression in renal cell carcinoma (RCC) cells. A Luciferase reporters were transfected into Caki-1 and 786-O cells with or without ADAMTS1 manipulation. All luciferase activity was normalized to Renilla reporter activity. The normalized reporter activity in cells transfected with a control vector was considered as onefold, and the relative fold change for each construct (ADAMTS1-flag or shADAMTS1) was further normalized to that of the control. B Reporters were transfected into Caki-1 and 786-O cells and treated with conditioned media (CM) collected from ADAMTS1-overexpressing or control Caki-1 and 786-O cells. The normalized reporter activity in cells treated with CM collected from control cells was considered onefold, and the relative fold change of RCC-derived CM treatment was calculated. The values are presented as the mean ± SD of three independent experiments. *p < 0.05, **p < 0.01, ***p < 0.001, compared with the control group. C Western blotting analysis of ADAMTS1 expression levels in cytoplasmic and nuclear fractions from Caki-1 and 786-O cells transfected with ADAMTS1-flag or a control vector. D The immunocomplex was precipitated from ADAMTS1-overexpressing Caki-1 cell lysates with an ADAMTS1 antibody and analyzed by western blotting to detect the associations of ADAMTS1 with indicated transcription factors (p53, WT1, and c-Jun). A normal IgG antibody was used as an immunoprecipitation (IP) control, and 10% whole-cell lysate was used as the input. E Western blot analysis of p53, ADAMTS1, p-EGFR, and EGFR levels in Caki-1 and 786-O cells after transducing ADAMTS1-flag or a control vector and treatment with the p53 inhibitor, pifithrin (PFT)-α (10 µM), or the vehicle for 24 h

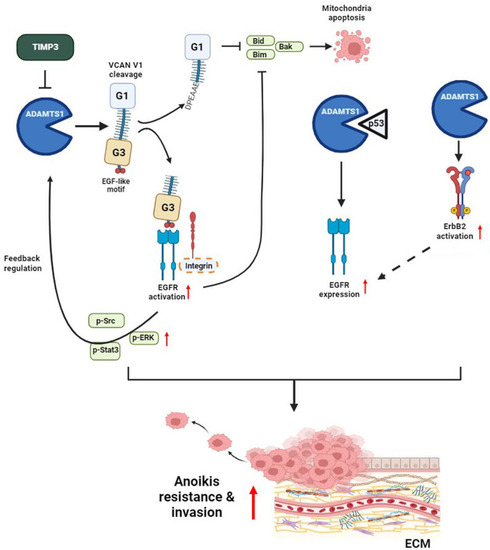
Schematic presentation depicting the ADAMTS1–VCAN–EGFR axis in promoting the anoikis resistance and invasive abilities of renal cell carcinoma (RCC). ADAMTS1 mediates the proteolytic cleavage of VCAN V1, thereby activating EGFR cascades to promote anoikis resistance and invasion of RCC cells. Moreover, ADAMTS1 interacts with p53 to modulate EGFR expression. EGFR-driven signaling might potentially reinforce ADAMTS1 expression through positive feedback. Bold dashed oval and arrow indicate hypothetical molecules and pathways that participate in ADAMTS1-mediated EGFR activation or expression. The cyclic elevation of ADAMTS1 and EGFR exacerbates anoikis resistance and invasiveness in RCC cells

Acknowledgments
This image is the copyrighted work of the attributed author or publisher, and ZFIN has permission only to display this image to its users. Additional permissions should be obtained from the applicable author or publisher of the image. Full text @ Cell Mol. Biol. Lett.