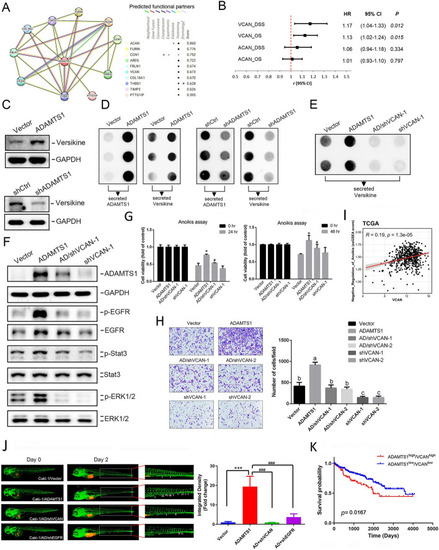
Versican (VCAN) cleavage is critical for ADAMTS1-mediated epidermal growth factor receptor (EGFR) activation, anoikis resistance, invasion, and metastasis of renal cell carcinoma (RCC) cells. A ADAMTS1 protein–protein interaction network of ten differentially expressed genes from the STRING database. B The forest plot illustrates hazard ratios (HRs) and 95% confidence intervals, examining the correlation between candidate genes [ACAN (aggrecan) and VCAN] and overall or disease-specific survival in patients with RCC. C and D Western blot and dot plot analyses respectively revealed levels of cleaved VCAN (versikine) (C) and secretion of ADAMTS1 and versikine (D) in ADAMTS1-manipulated Caki-1 cells. (E and F) Transfection of VCAN-specific shRNA into ADAMTS1-overexpressing Caki-1 cells led to the collection of conditioned media and cell lysates for detecting secreted versikine (E) and the expressions or phosphorylation of ADAMTS1, EGFR, ERK, and Stat3 (F). (I) Dot plot demonstrated the correlation between the single sample gene set enrichment analysis (ssGSEA) score of “negative regulation of anoikis” and VCAN expression in TCGA-KIRC patients. A Pearson correlation was performed to evaluate their association and significance. G, H, J Cell viability (G), cell invasive ability (H), and in vivo metastatic potential (J) of Caki-1 cells expressing VCAN or EGFR shRNA with or without coexpression of ADAMTS1-flag were respectively assessed under suspended conditions with a CCK8 assay, Matrigel invasion assay, and zebrafish xenograft model. Values are presented as the mean ± SD of three independent experiments. In G and J, statistical analysis was performed using Student’s t-test. *p < 0.05, ***p < 0.001, compared with the control group; #p < 0.05, ###p < 0.001, compared with the ADAMTS1-overexpressing only group. In H, data were analyzed using a one-way analysis of variance. Different letters represent various levels of significance. (K) High expression levels of both the ADAMTS1 and VCAN genes were associated with the poorest overall survival in patients with RCC. The p value reflects a comparison between ADAMTS1high/VCANhigh and ADAMTS1low/VCANlow. The RCC dataset was obtained from TCGA
|
