FIGURE

Fig. 1

ID
ZDB-FIG-240930-163
Publication
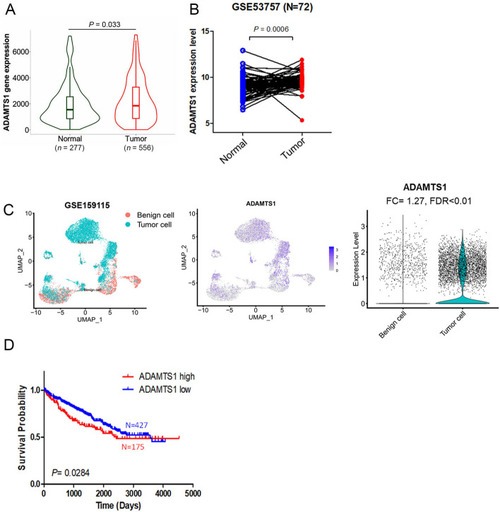
Wen et al., 2024 - The oncogenic ADAMTS1-VCAN-EGFR cyclic axis drives anoikis resistance and invasion in renal cell carcinoma
Other Figures
All Figure Page
Back to All Figure Page
Fig. 1

Elevated ADAMTS1 expression in renal cell carcinoma (RCC) tissues is associated with a poor prognosis. A ADAMTS1 mRNA levels in RCC tissues were significantly higher than those in normal renal tissues (p = 0.033) as determined by TNMplot (https://tnmplot.com/analysis/). B ADAMTS1 expression was assessed in 72 matched clear cell (cc)RCC tissues and their corresponding normal tissues using data from the GSE53757 ccRCC expression microarray dataset. C The left panel of the Uniform Manifold Approximation and Projection (UMAP) plot illustrates the distribution of tumor cells and benign epithelial cells based on single-cell RNA sequencing (scRNA-seq) profiles. The UMAP plot in the middle panel shows the expression distribution of ADAMTS1. The violin plot in right panel indicates that ADAMTS1 exhibits a significant elevation in tumor cells compared with benign epithelial cells, with a fold change (FC) of 1.27 and a false discovery rate (FDR) of less than 0.01. D Kaplan–Meier analysis depicts overall survival (OS) rates in patients with ccRCC based on high or low ADAMTS1 expression using data from TCGA

Expression Data

Expression Detail
Antibody Labeling
Phenotype Data

Phenotype Detail
Acknowledgments
This image is the copyrighted work of the attributed author or publisher, and ZFIN has permission only to display this image to its users. Additional permissions should be obtained from the applicable author or publisher of the image. Full text @ Cell Mol. Biol. Lett.