IMAGE

Fig. 3

ID
ZDB-IMAGE-240930-165
Source
Figures for Wen et al., 2024
Image
Figure Caption

Fig. 3

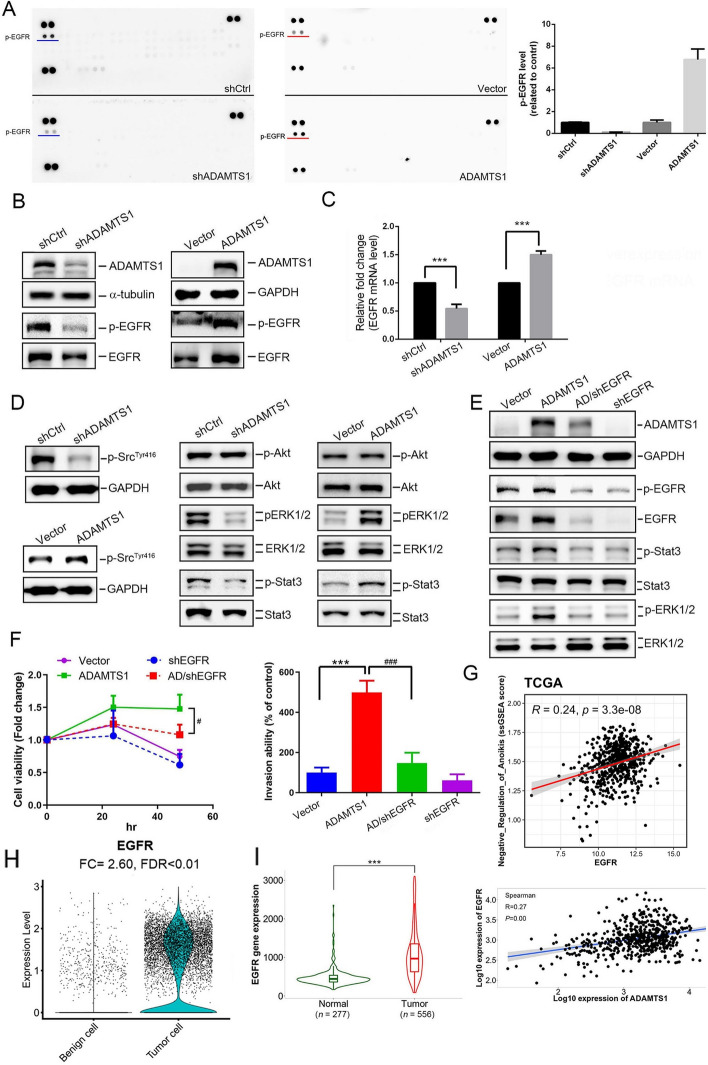
ADAMTS1 expression activates epidermal growth factor receptor (EGFR) signaling cascades to promote anoikis resistance of and invasion by Caki-1 renal cell carcinoma (RCC) cells. A Differential expression levels of phosphorylated receptor tyrosine kinases (RTKs) in cell lysates from AMAMTS1-manipulated Caki-1. An antibody array (R&D Systems) was used to detect 49 different phosphorylated human RTKs. The left panel shows representative array blots at a short exposure time (30 s). The right panel shows a quantitative analysis of phosphorylated (p)-EGFR using a densitometer. Values are presented as the mean ± SD. n = 2. BD Caki-1 cells were subjected to knockdown or overexpression of ADAMTS1 to assess protein levels of p-EGFR and EGFR (B), as well as their downstream signaling cascades (D), using western blotting. Additionally, mRNA levels of the EGFR were analyzed using a real-time qPCR (C). (E and F) EGFR shRNA was transfected into ADAMTS1-overexpressing Caki-1 cells as indicated, and cell lysates were collected to detect expressions or phosphorylation of ADAMTS1, EGFR, ERK, and Stat3 (E). Additionally, cell viability in suspended conditions (F, left) and the cell invasive ability (F, right) were respectively evaluated by CCK8 and Matrigel invasion assays. Multiples of differences are presented as the mean ± SD of three independent experiments. ***p < 0.001, compared with the control group; #p < 0.05, ###p < 0.001, compared with the ADAMTS1-overexpressing only group. (G) Dot plot demonstrated the correlation between the single sample gene set enrichment analysis (ssGSEA) score of “negative regulation of anoikis” and EGFR expression in TCGA-KIRC patients. A Pearson correlation was performed to evaluate their association and significance. (H) The violin plot indicates that EGFR expression is significantly higher in tumor cells compared with benign epithelial cells, with a fold change (FC) of 2.60 and a false discovery rate (FDR) of less than 0.01. (I) Left: EGFR mRNA levels in RCC tissues were significantly higher than those in normal renal tissues (p < 0.001). Right: a positive correlation between ADAMTS1 and EGFR expression in RCC tissues. The kidney cancer dataset was retrieved from the TNMplot database.

Acknowledgments
This image is the copyrighted work of the attributed author or publisher, and ZFIN has permission only to display this image to its users. Additional permissions should be obtained from the applicable author or publisher of the image. Full text @ Cell Mol. Biol. Lett.