FIGURE SUMMARY
Title

Expansion of a neural crest gene signature following ectopic MYCN expression in sympathoadrenal lineage cells in vivo

Authors
Ibarra-García-Padilla, R., Nambiar, A., Hamre, T.A., Singleton, E.W., Uribe, R.A.
Source
Full text @ PLoS One

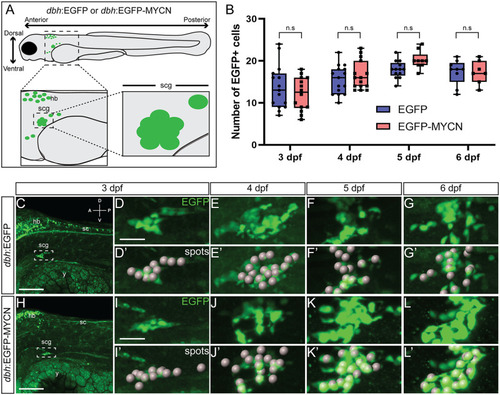
MYCN overexpression in SAP cells does not increase their cell numbers during early larval stages.

A) Cartoon model of a 3 dpf dbh:EGFP or dbh:EGFP-MYCN larval fish, depicting imaging regions and selection of the SCG as the region of interest (ROI). B) Quantification of cells detected at 3, 4, 5, and 6 dpf after “spots” detection using IMARIS. For 3 dpf EGFP n = 15, EGFP-MYCN n = 14; for 4 dpf EGFP n = 15, EGFP-MYCN n = 15; for 5 dpf EGFP n = 13, EGFP-MYCN n = 9; and for 6 dpf EGFP n = 9, EGFP-MYCN n = 7. C-L) Representative images of dbh:EGFP (C-G) or dbh:EGFP-MYCN (H-L) larvae from 3 to 6 dpf. Boxed region represents the SCG. ROI from 3, 4, 5, and 6 dpf larvae is shown in full detail (D-G, H-L), with the cells detected after performing the spots pipeline in IMARIS (D’-G’, H’-L’). A (anterior), P (posterior), D (dorsal), V (ventral) axes shown in upper right corner. hb = developing hindbrain, sc = developing spinal cord, cg = developing cranial ganglia, scg = developing superior cervical ganglia, y = yolk. Scale bars = 100 μm for full size image, 25 μm cropped images. n.s., non-significant (P>0.05).

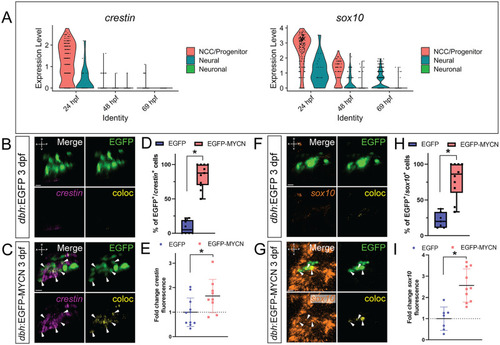
MYCN overexpressing SAP cells display an ectopic NCC gene expression signature.

A) Violin plots depicting crestin (left) and sox10 (right) expression from single cell datasets of sox10 derived cells at 24, 48, and 69 hpf. B,C,F,G) WICHCR performed using HCR probes against crestin (B,C) or sox10 (F,G) and with antibody against EGFP on 3 dpf dbh:EGFP (B,F) and dbh:EGFP-MYCN (C,G) larvae. Representative images of the SCG region reveal expression of the markers and their colocalized channel (coloc). D,H) Percentage of EGFP+ or EGFP-MYCN+ cells co-expressing crestin (D) or sox10 (H) in 3 dpf larvae. For crestin EGFP n = 8, EGFP-MYCN n = 11; for sox10 EGFP n = 7, EGFP-MYCN n = 10. E,I) Mean crestin (E) or sox10 (I) fluorescence intensity quantified in the SCG and normalized to dbh:EGFP average intensity at 3 dpf. For crestin EGFP n = 11, EGFP-MYCN n = 8; for sox10 EGFP n = 7, EGFP-MYCN n = 10. Markers: EGFP (green), crestin (magenta), sox10 (orange) and coloc channel (yellow). A (anterior), P (posterior), D (dorsal), V (ventral) axes shown in upper left corner. Scale bars = 10 μm. For all graphs * P<0.05.

MYCN overexpression in SAP cells leads to sox10 reporter activity expansion in vivo.

A-F) Confocal images of the developing SCG from different time points during live imaging of sox10:mRFP;dbh:EGFP (A,C,E), or sox10:mRFP;dbh:EGFP-MYCN (B,D,F) larvae from ~70 hpf to ~118 hpf. Markers: EGFP (green), sox10 reporter: mRFP (magenta), and coloc channel (yellow). sox10 reporter expression of mRFP within the developing SCG is visible in MYCN-EGFP overexpressing larvae (B’,D’, F’) compared to EGFP control larvae, (A’, C’, E’) with higher reporter levels at earlier timepoints. Scale bars = 50 μm for uncropped images, 20 μm for cropped images.

MYCN overexpressing cells contain a SAP gene expression signature at 3 dpf.

A,B,E,F) WICHCR performed using HCR probes against phox2bb (A,B) or dbh (E,F) and with antibody against EGFP on 3 dpf dbh:EGFP (A,E) and dbh:EGFP-MYCN (E,F) larvae. Representative images reveal expression of the markers and their colocalized channel (coloc) within the SCG. C,G) Percentage of EGFP+ or EGFP-MYCN+ cells co-expressing phox2bb (C) or dbh (G) in 3 dpf larvae. For phox2bb EGFP n = 8, EGFP-MYCN n = 11; for dbh EGFP n = 4, EGFP-MYCN n = 4. D,H) Mean phox2bb (D) or dbh (H) fluorescence intensity quantified in the SCG and normalized to dbh:EGFP average intensity at 3 dpf. For phox2bb EGFP n = 8, EGFP-MYCN n = 12; for dbh EGFP n = 8, EGFP-MYCN n = 12. Markers: EGFP (green), phox2bb or dbh (cyan) and coloc channel (yellow). A (anterior), P (posterior), D (dorsal), V (ventral) axes shown in upper left corner. Scale bars = 10 μm. I) Violin plot showing phox2bb expression from single cell datasets of sox10 derived cells at 24, 48, and 69 hpf. J,K) Representative images of SCG from dbh:EGFP (J) and dbh:EGFP-MYCN (K) larvae after immunofluorescence against Phox2b and EGFP at 3 dpf. L) Mean Phox2b fluorescence intensity quantified in the SCG and normalized to dbh:EGFP average intensity at 3 dpf. Markers: EGFP (green), Phox2b (pink). Scale bars = 7 μm. For all graphs n.s., non-significant (P>0.05).

Ectopic MYCN expression results in an aberrant SAP population that co-expresses NCC and neuronal markers at 4 dpf.

A) Cartoon depicting the z-slice through the SCG for quantifying individual triple positive (EGFP+/crestin+/elavl3+) cells. B) Percentage of triple positive cells (EGFP+/crestin+/elavl3+) detected in dbh:EGFP or dbh:EGFP-MYCN larvae at 4 dpf. For EGFP n = 7, EGFP-MYCN n = 10. C,D) Representative images from sections through the developing SCG in dbh:EGFP (C) or dbh:EGFP-MYCN (D) larvae at 4 dpf. WICHCR performed using HCR probes against crestin, elavl3, and with antibody against EGFP. Triple positive (EGFP+/crestin+/elavl3+) cells can be seen in MYCN overexpressing larvae. Markers: EGFP (green), crestin (magenta), and elavl3 (cyan). Scale bar = 10 μm. * P<0.05.

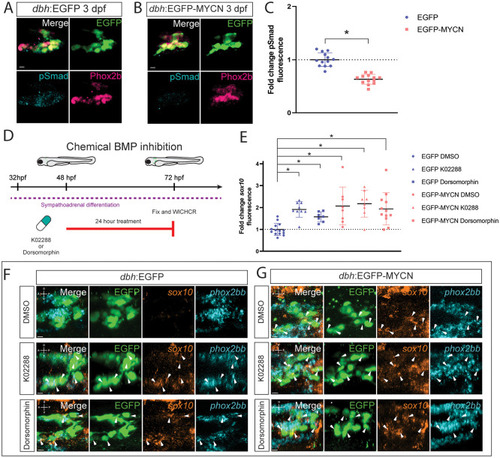
BMP signaling activity is dampened within developing EGCP-MYCN+ larvae.

A,B) Representative images of SCG from dbh:EGFP (A) and EGFP-MYCN (B) larvae after immunofluorescence against Phox2b and EGFP. Markers: EGFP (green), pSmad1/5/8 (cyan), and Phox2b (pink). C) Mean pSmad1/5/8 fluorescence intensity quantified in the SCG and normalized to dbh:EGFP average intensity at 3 dpf. For EGFP n = 13, EGFP-MYCN n = 13. D) Schematic of treatment with 10μM K02288 or 50 μM Dorsomorphin embryos were treated at 48 hpf for 24 hours and then fixed at 72 hpf. E) Mean sox10 fluorescence intensity quantified in the SCG and normalized to dbh:EGFP average intensity at 3 dpf. For EGFP DMSO n = 14, EGFP K02288 n = 9, EGFP Dorsomorphin n = 7, EGFP-MYCN DMSO n = 8, EGFP-MYCN K02288 n = 8, EGFP-MYCN Dorsomorphin n = 12. F,G) Representative images from developing SCG in dbh:EGFP (F) or dbh:EGFP-MYCN (G) larvae at 3 dpf after 24 h treatment with either DMSO (F,G, upper panels),K02288 (F,G, middle panels), or Dorsomorphin (F,G, lower panels). WICHCR performed using HCR probes against sox10, phox2bb, and with antibody against EGFP. K02288 and Dorsomorphin treatments cause expansion of sox10 expression in EGFP+ larvae, similar to the expansion seen in MYCN+ larvae in either condition. Markers: EGFP (green), sox10 (orange), and phox2bb (cyan). Scale bar = 7 μm. For all graphs * P<0.05, n.s., non-significant (P>0.05).

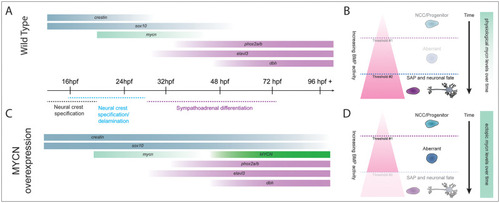
MYCN overexpression produces a cellular population with aberrant gene expression and a dampened BMP response.

A,C) Normal NCC differentiation towards SAP fate requires a fine-tuned expression of transcription factors and differentiation effectors. sox10 and crestin (in zebrafish) are expressed during early NCC specification and retain their expression during NCC migration. As NCC undergo epithelial to mesenchymal transition (EMT) and migrate they transiently express mycn. When NCC receive SAP differentiation signals, they downregulate expression of early NCC genes and commence the expression of genes required for sympathoadrenal specification like phox2bb, elavl3 and dbh. C) The ectopic expression of MYCN causes a change in the developmental program and timing of these cells, where NCC markers like crestin and sox10, present expanded expression concurrent with SAP differentiation markers like phox2bb, elavl3, and dbh. B,D) Proposed model where MYCN overexpression disrupts SAP neuronal differentiation, possibly via alterations in BMP signaling. B) SAP development progresses correctly when the physiological levels of MYCN are controlled over time, and cells are able to respond to BMP signals and reach their final fate. D) In MYCN-overexpressing conditions, cells can no longer establish a proper BMP response to undergo neuronal differentiation, creating an aberrant population that contains NCC and SAP markers.

Acknowledgments
This image is the copyrighted work of the attributed author or publisher, and ZFIN has permission only to display this image to its users. Additional permissions should be obtained from the applicable author or publisher of the image. Full text @ PLoS One