|
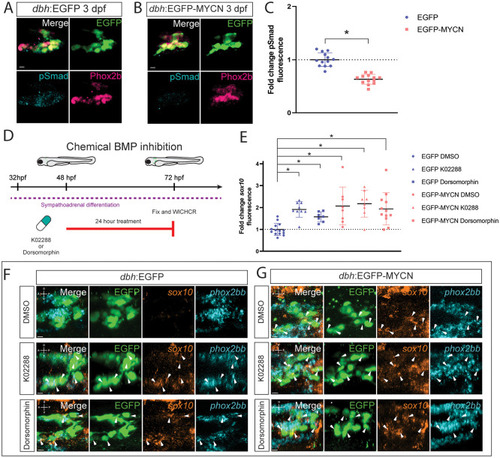
BMP signaling activity is dampened within developing EGCP-MYCN+ larvae. A,B) Representative images of SCG from dbh:EGFP (A) and EGFP-MYCN (B) larvae after immunofluorescence against Phox2b and EGFP. Markers: EGFP (green), pSmad1/5/8 (cyan), and Phox2b (pink). C) Mean pSmad1/5/8 fluorescence intensity quantified in the SCG and normalized to dbh:EGFP average intensity at 3 dpf. For EGFP n = 13, EGFP-MYCN n = 13. D) Schematic of treatment with 10μM K02288 or 50 μM Dorsomorphin embryos were treated at 48 hpf for 24 hours and then fixed at 72 hpf. E) Mean sox10 fluorescence intensity quantified in the SCG and normalized to dbh:EGFP average intensity at 3 dpf. For EGFP DMSO n = 14, EGFP K02288 n = 9, EGFP Dorsomorphin n = 7, EGFP-MYCN DMSO n = 8, EGFP-MYCN K02288 n = 8, EGFP-MYCN Dorsomorphin n = 12. F,G) Representative images from developing SCG in dbh:EGFP (F) or dbh:EGFP-MYCN (G) larvae at 3 dpf after 24 h treatment with either DMSO (F,G, upper panels),K02288 (F,G, middle panels), or Dorsomorphin (F,G, lower panels). WICHCR performed using HCR probes against sox10, phox2bb, and with antibody against EGFP. K02288 and Dorsomorphin treatments cause expansion of sox10 expression in EGFP+ larvae, similar to the expansion seen in MYCN+ larvae in either condition. Markers: EGFP (green), sox10 (orange), and phox2bb (cyan). Scale bar = 7 μm. For all graphs * P<0.05, n.s., non-significant (P>0.05).
|