IMAGE

Fig 4

ID
ZDB-IMAGE-240921-4
Source
Figures for Ibarra-García-Padilla et al., 2024
Image
Figure Caption

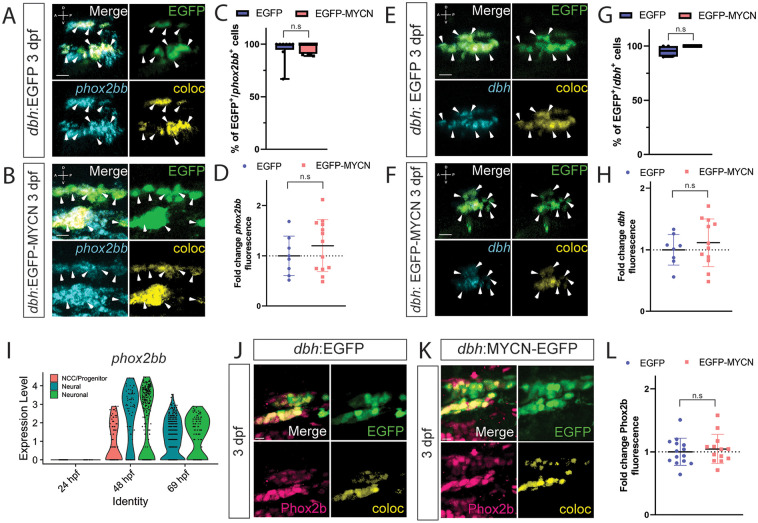
Fig 4 MYCN overexpressing cells contain a SAP gene expression signature at 3 dpf.

A,B,E,F) WICHCR performed using HCR probes against phox2bb (A,B) or dbh (E,F) and with antibody against EGFP on 3 dpf dbh:EGFP (A,E) and dbh:EGFP-MYCN (E,F) larvae. Representative images reveal expression of the markers and their colocalized channel (coloc) within the SCG. C,G) Percentage of EGFP+ or EGFP-MYCN+ cells co-expressing phox2bb (C) or dbh (G) in 3 dpf larvae. For phox2bb EGFP n = 8, EGFP-MYCN n = 11; for dbh EGFP n = 4, EGFP-MYCN n = 4. D,H) Mean phox2bb (D) or dbh (H) fluorescence intensity quantified in the SCG and normalized to dbh:EGFP average intensity at 3 dpf. For phox2bb EGFP n = 8, EGFP-MYCN n = 12; for dbh EGFP n = 8, EGFP-MYCN n = 12. Markers: EGFP (green), phox2bb or dbh (cyan) and coloc channel (yellow). A (anterior), P (posterior), D (dorsal), V (ventral) axes shown in upper left corner. Scale bars = 10 μm. I) Violin plot showing phox2bb expression from single cell datasets of sox10 derived cells at 24, 48, and 69 hpf. J,K) Representative images of SCG from dbh:EGFP (J) and dbh:EGFP-MYCN (K) larvae after immunofluorescence against Phox2b and EGFP at 3 dpf. L) Mean Phox2b fluorescence intensity quantified in the SCG and normalized to dbh:EGFP average intensity at 3 dpf. Markers: EGFP (green), Phox2b (pink). Scale bars = 7 μm. For all graphs n.s., non-significant (P>0.05).

Acknowledgments
This image is the copyrighted work of the attributed author or publisher, and ZFIN has permission only to display this image to its users. Additional permissions should be obtained from the applicable author or publisher of the image. Full text @ PLoS One