FIGURE

Fig 1

ID
ZDB-FIG-240921-1
Publication
Ibarra-García-Padilla et al., 2024 - Expansion of a neural crest gene signature following ectopic MYCN expression in sympathoadrenal lineage cells in vivo
Other Figures
All Figure Page
Back to All Figure Page
Fig 1

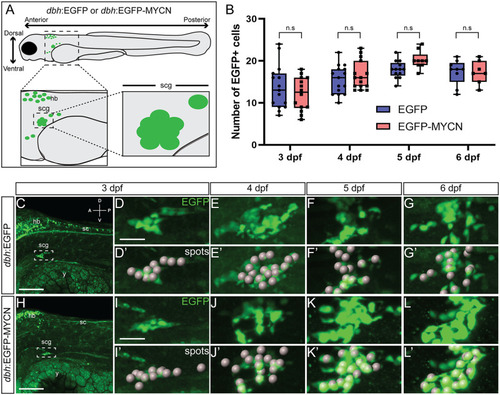
MYCN overexpression in SAP cells does not increase their cell numbers during early larval stages.

A) Cartoon model of a 3 dpf dbh:EGFP or dbh:EGFP-MYCN larval fish, depicting imaging regions and selection of the SCG as the region of interest (ROI). B) Quantification of cells detected at 3, 4, 5, and 6 dpf after “spots” detection using IMARIS. For 3 dpf EGFP n = 15, EGFP-MYCN n = 14; for 4 dpf EGFP n = 15, EGFP-MYCN n = 15; for 5 dpf EGFP n = 13, EGFP-MYCN n = 9; and for 6 dpf EGFP n = 9, EGFP-MYCN n = 7. C-L) Representative images of dbh:EGFP (C-G) or dbh:EGFP-MYCN (H-L) larvae from 3 to 6 dpf. Boxed region represents the SCG. ROI from 3, 4, 5, and 6 dpf larvae is shown in full detail (D-G, H-L), with the cells detected after performing the spots pipeline in IMARIS (D’-G’, H’-L’). A (anterior), P (posterior), D (dorsal), V (ventral) axes shown in upper right corner. hb = developing hindbrain, sc = developing spinal cord, cg = developing cranial ganglia, scg = developing superior cervical ganglia, y = yolk. Scale bars = 100 μm for full size image, 25 μm cropped images. n.s., non-significant (P>0.05).

Expression Data

Expression Detail
Antibody Labeling
Phenotype Data

Phenotype Detail
Acknowledgments
This image is the copyrighted work of the attributed author or publisher, and ZFIN has permission only to display this image to its users. Additional permissions should be obtained from the applicable author or publisher of the image. Full text @ PLoS One