
- Title
-
Delving into the Complexity of Valproate-Induced Autism Spectrum Disorder: The Use of Zebrafish Models
- Authors
- Camussi, D., Naef, V., Brogi, L., Della Vecchia, S., Marchese, M., Nicoletti, F., Santorelli, F.M., Licitra, R.
- Source
- Full text @ Cells
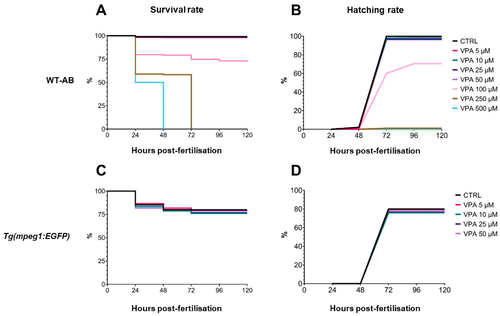
Effect of valproic acid (VPA) on zebrafish larval survival and hatching rates at up to 120 h post-fertilisation (hpf) (n = 120 per group). (A) Kaplan–Meier survival comparison in WT-AB fish showed a significant effect [log-rank (Mantel–Cox) test] of VPA treatment at 100 (p ≤ 0.05), 250, and 500 μM (p ≤ 0.0001) as compared with untreated controls (CTRL) as early as 24 hpf. (B) The hatching rate of WT-AB fish was significantly affected [log-rank (Mantel–Cox) test] by VPA treatment with doses of 100 (p ≤ 0.05), 250, and 500 μM (p ≤ 0.0001) at 72 hpf. (C,D) Survival and hatching rates of Tg(mpeg1:EGFP) transgenic fish were not influenced by any tested treatment (p > 0.05). |
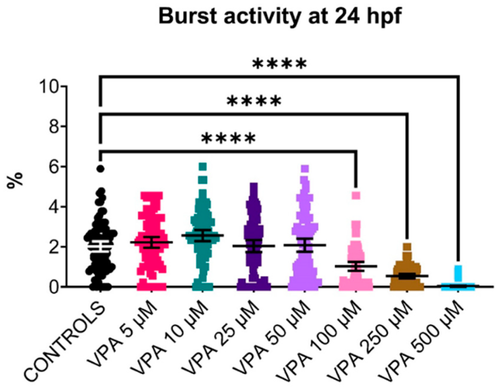
Effect of valproic acid (VPA) on WT-AB embryo burst activity at 24 h post-fertilisation (hpf) (n = 90 per group). The tail-coiling test results showed a significant reduction (**** p ≤ 0.0001, Kruskal–Wallis test) in burst activity of embryos treated with VPA at doses higher than 50 μM compared with untreated controls. Data are represented as individual values (lines indicate means ± SEM). |
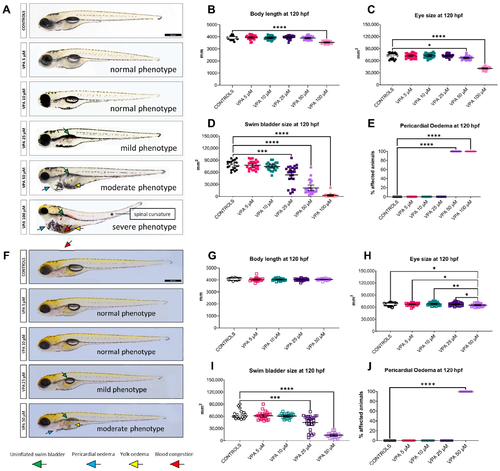
Effects of valproic acid (VPA) on larval morphology at 120 h post-fertilisation (hpf) (n = 24 per group). (A) Representative images of WT-AB untreated controls and VPA-treated larvae. (B–E) Morphological evaluation in WT-AB fish showed significant effects (* p ≤ 0.05, *** p ≤ 0.001, **** p ≤ 0.0001, Kruskal–Wallis test) of VPA treatment at doses higher than 25 μM as compared with untreated controls for all measured parameters. (F) Representative images of Tg(mpeg1:EGFP) untreated controls and VPA-treated larvae. (G–J). Morphological evaluation of Tg(mpeg1:EGFP) fish showed a significant effect (* p ≤ 0.05, ** p ≤ 0.01, *** p ≤ 0.001, **** p ≤ 0.0001, Kruskal–Wallis test) of VPA treatment at 50 μM as compared with untreated controls for eye size, swim bladder size, and presence of pericardial oedema. Data are represented as individual values (lines indicate means ± SEM). |
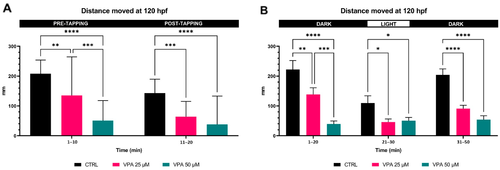
Effects of valproic acid (VPA) on locomotor behaviour in WT-AB larvae at 120 h post-fertilisation (hpf) (n = 24 per group). (A) Startle response data analysis showed significant dose-dependent reductions of larval locomotor activity, both before and after the mechanical stimulation (** p ≤ 0.01, *** p ≤ 0.001, **** p ≤ 0.0001, two-way ANOVA test). (B) Visual motor response data analysis showed significant dose-dependent reductions of larval locomotor performance in both dark and light conditions (* p ≤ 0.05, ** p ≤ 0.01, *** p ≤ 0.001, **** p ≤ 0.0001, two-way ANOVA test). Data are represented as means ± SEM |
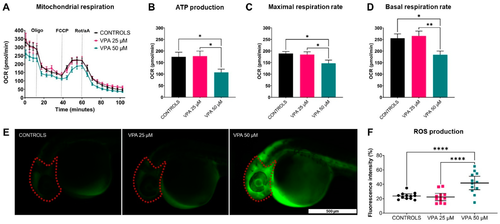
Effects of valproic acid (VPA) on WT-AB mitochondrial respiration at 120 h post-fertilisation (hpf) and on reactive oxygen species (ROS) accumulation at 30 hpf (n = 12 per group). (A) Mitochondrial respiratory analysis showed a decreased oxygen consumption rate (OCR) in 50 μM VPA-treated larvae compared with controls and 25 μM VPA-treated larvae. (B–D) ATP production and both maximal and basal respiration rates were reduced in 50 μM VPA-treated larvae compared with controls and 25 μM VPA-treated larvae (* p ≤ 0.05, ** p ≤ 0.01, t-test with Welch correction). Data are represented as mean ± SEM. (E) Representative fluorescence images of ROS production in controls and VPA-treated larvae, with red dotted lines indicating the region of interest. (F) Quantitative analysis of ROS production showed a significant increase in 50 μM VPA-treated larvae compared with controls and 25 μM VPA-treated larvae (**** p ≤ 0.0001, t-test with Welch correction). Data are represented as individual values (lines indicate means ± SEM). |
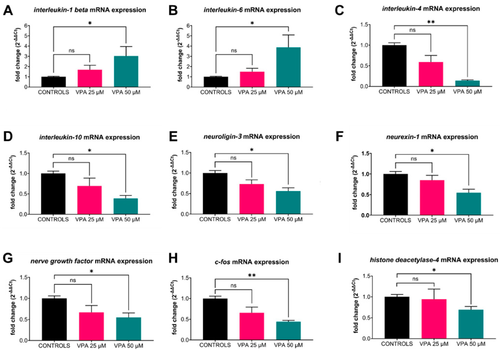
Effects of valproic acid (VPA) on WT-AB larvae mRNA gene expression values at 120 h post-fertilisation (hpf) (n = 90 per group). (A,B) Data analysis showed a significant upregulation of pro-inflammatory cytokines (IL-1β and IL-6) in 50 μM VPA-treated larvae compared with controls (* p ≤ 0.05, t-test with Welch correction). (C,D) Anti-inflammatory cytokines (IL-4 and IL-10) were downregulated in 50 μM VPA-treated larvae compared with controls (* p ≤ 0.05, t-test with Welch correction). (E–H) Neurogenesis- and neuronal activation-related genes (nlgn3, nrxn1, ngf, and c-fos) were downregulated in 50 μM VPA-treated larvae compared with controls (* p ≤ 0.05 or ** p ≤ 0.01, t-test with Welch correction). (I) Expression of the VPA-target gene (hdac4) was downregulated in 50 μM VPA-treated larvae compared with controls (* p ≤ 0.05, t-test with Welch correction). Data are represented as means ± SEM. Abbreviations: ns = not significant. |
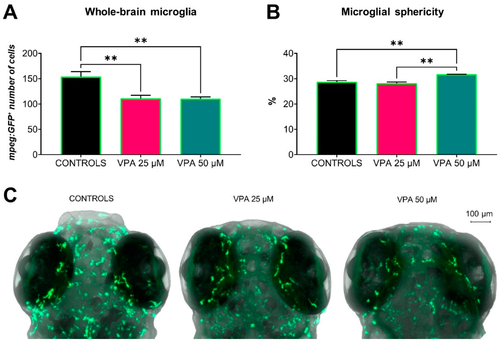
Effects of valproic acid (VPA) on Tg(mpeg1:EGFP) microglial cell status at 120 h post-fertilisation (n = 3 per group). (A) Whole-brain analysis showed a significantly decreased number of microglia in VPA-treated larvae compared with controls (** p ≤ 0.01, t-test with Welch correction). (B) Analysis of microglial cell morphology showed significantly increased sphericity in 50 μM VPA-treated larvae compared with controls and 25 μM VPA-treated larvae (** p ≤ 0.01, t-test with Welch correction). Data are represented as means ± SEM. (C) Representative confocal images of microglial cell morphology in controls and VPA-treated larvae. |
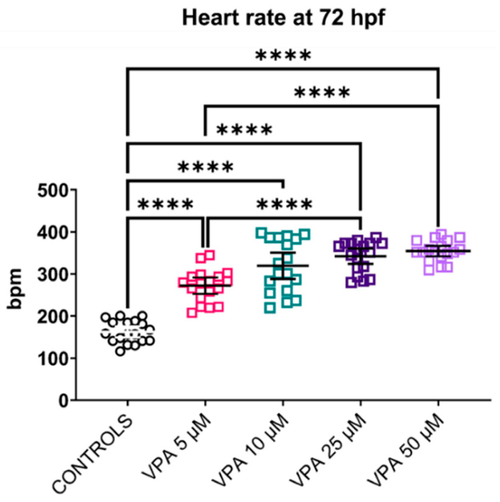
Effects of valproic acid (VPA) on heart rate in Tg(mpeg1:EGFP) larvae at 72 h post-fertilisation (hpf) (n = 24 per group). Heart rate analysis showed increased beats per minute (bpm) in all larvae treated with VPA (**** p ≤ 0.0001, Welch’s ANOVA test) compared with untreated controls. Data are represented as individual values (lines indicate means ± SEM). |
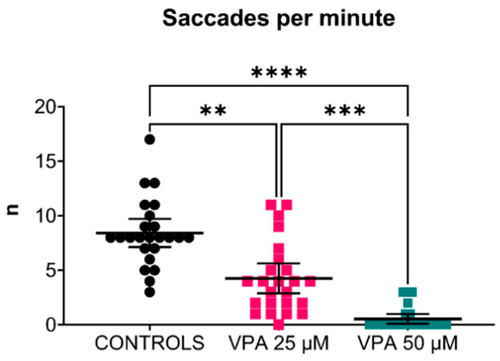
Effects of valproic acid (VPA) on optokinetic response in Tg(mpeg1:EGFP) larvae at 120 h post-fertilisation (n = 24 per group). Data analysis showed a significantly decreased number of saccades per minute in VPA-treated larvae compared with controls (** p ≤ 0.01, *** p ≤ 0.001, Kruskal–Wallis test). The difference was greater between the controls and the 50 μM VPA-treated larvae (**** p ≤ 0.0001, Kruskal–Wallis test). Data are represented as individual values (lines indicate means with 95% confidence interval). |