
Fig. 7
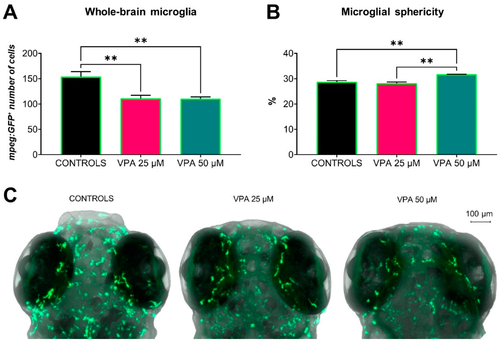
Effects of valproic acid (VPA) on Tg(mpeg1:EGFP) microglial cell status at 120 h post-fertilisation (n = 3 per group). (A) Whole-brain analysis showed a significantly decreased number of microglia in VPA-treated larvae compared with controls (** p ≤ 0.01, t-test with Welch correction). (B) Analysis of microglial cell morphology showed significantly increased sphericity in 50 μM VPA-treated larvae compared with controls and 25 μM VPA-treated larvae (** p ≤ 0.01, t-test with Welch correction). Data are represented as means ± SEM. (C) Representative confocal images of microglial cell morphology in controls and VPA-treated larvae. |