FIGURE SUMMARY
Title

Induction of seizures and initiation of epileptogenesis by pilocarpine in zebrafish larvae

Authors
Gawel, K., Hulas-Stasiak, M., Marszalek-Grabska, M., Grenda, A., Siekierska, A., Kosheva, N., van der Ent, W., Esguerra, C.V., Krawczyk, P., Turski, W.A.
Source
Full text @ Front. Mol. Neurosci.

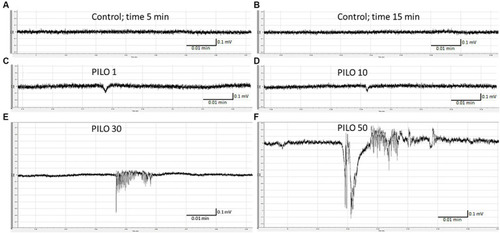
Local field potentials (LFPs) recorded from the brain of zebrafish larvae exposed to pilocarpine (PILO) at different concentrations. Larvae were incubated in different concentrations of PILO (1, 10, 30 or 50 mM) for 5 min, and, afterwards, LFPs were recorded for 20 min: (A,B) control recording; (C–F) representative pattern of electrographic events recorded after acute exposure of larvae to PILO.

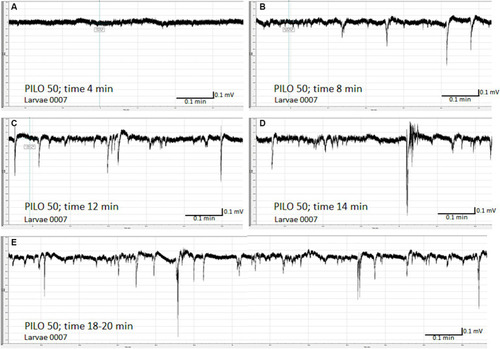
Time-dependent evolution of electroencephalographic changes recorded from the brain of zebrafish larvae exposed to pilocarpine (PILO). Larvae was incubated in medium containing PILO (50 mM) for 5 min, and, afterwards, LFPs were recorded for 20 min: (A) 4 min after start of recording, no clear-cut seizure-like events are present; (B) 8 min after start of recording, short ictal and interictal events are seen; (C) 12 min after start of recording; progression of seizure-like ictal and interictal activity is evidenced (D) 14 min after start of recording, further progression and intensification of seizure-like ictal and interictal activity is shown; (E) 18–20 min after start of recording, prolonged and continuous convulsion-like activity.

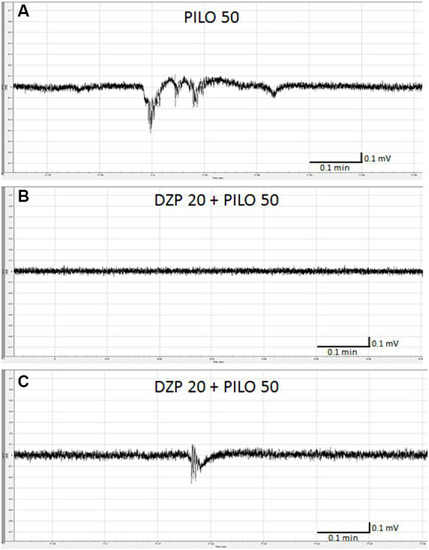
Effect of diazepam (DZP) on PILO-induced local field potential (LFP) events. Larvae were incubated in medium containing DZP (20 μM) for 20 h, and, subsequently, PILO was added to wells (final concentration = 50 mM). After 5 min incubation with PILO, LFPs recording were performed: (A) control recording of seizure-like events as presented on the graph evoked by PILO 50 mM; (B) representative LFP recordings performed in larvae exposed to DZP 20 μM + PILO 50 mM, note that in 3 out of 4 larvae, no seizure-like activity was recorded within 20 min of analysis, (C) only 2 short-lasting, low amplitude seizure-like events were found in larvae no. 3 within 20 min of analysis.

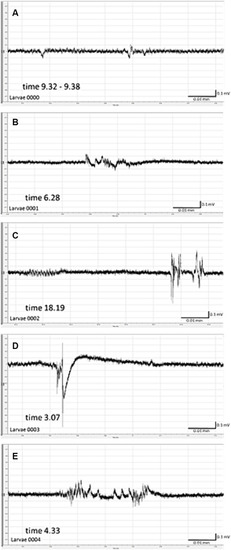
Spontaneous local field potentials (LFPs) recorded from the brain of zebrafish larvae previously exposed to pilocarpine (PILO). Larvae were incubated in medium containing PILO (50 mM) for 120 min, and, afterwards, larvae were thoroughly washed out 5 times in fresh medium and incubated in PILO-free medium for the next 22 h. Subsequently, LFP recordings were performed: (A–E) representative pattern of electrographic events recorded 22 h after acute exposure to PILO (50 mM). Note unprovoked, recurrent abrupt seizure-like events with miscellaneous patterns, duration and amplitude.

Locomotor activity of zebrafish larvae acutely exposed to pilocarpine (PILO). Larvae were incubated in different concentrations of PILO (1, 10, 30 or 50 mM) for 5 min and afterward locomotor activity assay was conducted for 60 min: (A) representative track visualizations which show the manner and intensity of zebrafish larvae movement in the well area (red line); the analysis was conducted at 9–10 min interval. (B,a) Each point represents median value of distance traveled at 1 min intervals; (b) locomotion was presented as a linear trend—the equation y = mx + c and squared value R2 are given in the graph; (c) total distance traveled in 60 min (data are presented as median values)—statistical analysis was performed using nonparametric ANOVA Kruskal–Wallis test, followed by Dunn’s Multiple Comparisons test (significance level was set at p < 0.05); (d) the pie charts show the fractions of larvae in quartiles: LM—larvae with low total mobility, M—larvae with medium total mobility, HM—larvae with high total mobility—statistical analysis was performed using chi-square (χ2) statistics (significance level was set at p < 0.05, number of subjects analyzed N = 32/group). (C,a) Each point represents median value of movement time registered at 1 min intervals; (b) movement time was presented as a linear trend; (c) total distance traveled in 60 min; (d) the pie charts show the fractions of larvae in quartiles; presentation of results and statistical analysis as described in (B,a). (D,a) Each point represents median value of movement velocity registered at 1 min intervals; (b) movement velocity presented as a linear trend; (c) mean movement velocity traveled in 60 min; (d) the pie charts show the fractions of larvae in quartiles: LM—larvae with low total mobility, M—larvae with moderate total mobility, HM—larvae with high total mobility; presentation of results and statistical analysis as described in (B,a).

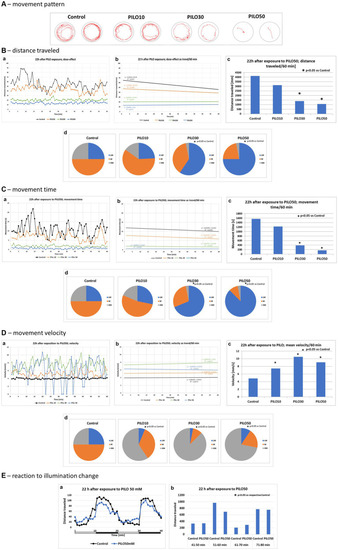
Locomotor activity of zebrafish larvae 22 h after exposition to pilocarpine (PILO). Larvae were incubated in different concentrations of PILO (10, 30 or 50 mM) for 120 min. Next, larvae were thoroughly washed out 5 times, and incubated in fresh medium for subsequent 22 h. Afterwards, locomotor activity assay was conducted for 120 min: (A) representative track visualizations which show the manner and intensity of zebrafish larvae movement in the well area (red line)—the analysis was conducted at 9–10 min interval. (B,a) Each point represents median value of distance traveled at 1 min intervals; (b) locomotion was presented as a linear trend; the equation y = mx + c and squared value R2 are given in the graph; (c) total distance traveled in 60 min (data are presented as median values)—statistical analysis was performed using nonparametric ANOVA Kruskal–Wallis test, followed by Dunn’s Multiple Comparisons test (significance level was set at p < 0.05); (d) the pie charts show the fractions of larvae in quartiles: LM—larvae with low total mobility, M—larvae with medium total mobility, HM—larvae with high total mobility; statistical analysis was performed using chi-square (χ2) statistics (significance level was set at p < 0.05, number of subjects analyzed was N = 32 in control groups and in each PILO exposed group). (C,a) Each point represents median value of movement time registered at 1 min intervals; (b) movement time was presented as a linear trend; (c) total distance traveled in 60 min; (d) the pie charts show the fractions of larvae in quartiles; presentation of results and statistical analysis as described in (B,a). (D,a) Each point represents median value of movement velocity registered at 1 min intervals; (b) movement velocity presented as a linear trend; (c) mean movement velocity traveled in 60 min; (d) the pie charts show the fractions of larvae in quartiles: LM—larvae with low total mobility, M—larvae with moderate total mobility, HM—larvae with high total mobility; presentation of results and statistical analysis as described in (B,a). (E) Dark–light assay was conducted with following phases: 100% light–100% dark—100% light–100% dark, 10 min each: (a) each point represents median value of distance traveled at 1 min intervals; horizontal white-black bar illustrates the sequence of illumination changes, light and darkness alternately; (b) total distance traveled in 10 min intervals; horizontal white-black bar illustrates the sequence of illumination changes, light and darkness alternately (data are presented as median values)—statistical analysis was performed using nonparametric ANOVA Kruskal–Wallis test, followed by Dunn’s Multiple Comparisons test (significance level was set at p < 0.05, number of subjects analyzed was N = 16/control group and N = 32/each PILO exposed group).

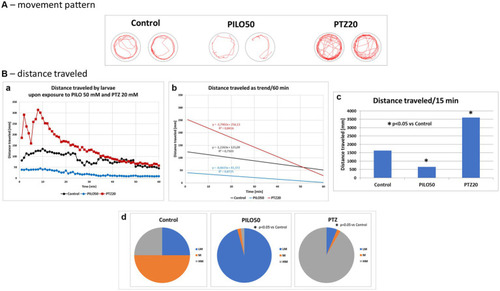
Comparison of locomotor activity of zebrafish larvae exposed to pilocarpine (PILO) or pentylenetetrazole (PTZ). Larvae were incubated in medium containing PILO (50 mM) or PTZ (20 mM) for 5 min, and, afterwards, locomotor activity assay was conducted for 60 min at 1 min intervals: (A) representative track visualizations which show the manner and intensity of zebrafish larvae movement in the well area (red line); the analysis was conducted at 9–10 min trial, the time of highest activity of larvae exposed to PTZ. (B,a) Each point represents median value of distance traveled at 1 min intervals; (b) locomotion was presented as a linear trend—the equation y = mx + c and squared value R2 are given in the graph; (c) total distance traveled in 60 min (data are presented as median values)—statistical analysis was performed using nonparametric ANOVA Kruskal–Wallis test, followed by Dunn’s Multiple Comparisons test (significance level was set at p < 0.05); (d) the pie charts show the fractions of larvae in quartiles: LM—larvae with low total mobility, M—larvae with moderate total mobility, HM—larvae with high total mobility; statistical analysis was performed using chi-square (χ2) statistics (significance level was set at p < 0.05, number of subjects N = 48/group).

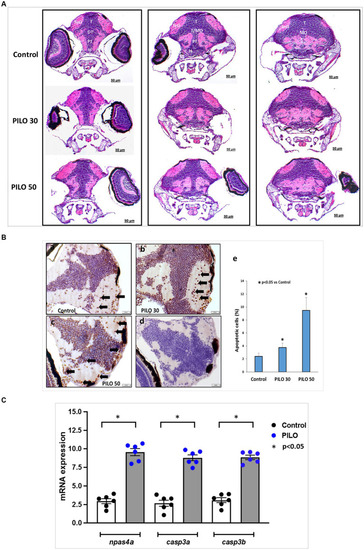
Histological changes in the brain of zebrafish larvae exposed to pilocarpine (PILO). (A) Brain morphology under hematoxylin and eosin (H&E) staining—larvae were incubated in medium containing PILO (30 or 50 mM) for 2 h. Next, larvae were thoroughly washed out × 5 times and incubated in fresh medium for subsequent 22 h. Afterwards, larvae were cooled down and fixed in 10% buffered formalin for 24 h at room temperature and processed for further analysis. DT, dorsal thalamus; H, hypothalamus; MO, medulla oblongata; PT, posterior tuberculum; T, midbrain tegmentum; TeO, tectum opticum; T/MO, midbrain tegmentum/medulla oblongata boundary. (B) Apoptosis evaluated by means of TUNEL staining. Larvae were incubated in medium containing PILO (30 or 50 mM) for 2 h. Next, larvae were thoroughly washed out × 5 times and incubated in fresh medium for subsequent 22 h. Afterwards, larvae were cooled down and fixed in 10% buffered formalin for 24 h at room temperature and processed for further analysis: (a–c) TUNEL staining, arrows indicate representative TUNEL-positive cells marked as dark brown; (d) a negative control was performed without active TdTenzyme; (e) the percentage of apoptotic cells over the total cell number per section per larva—the data are presented as the means ± standard deviations (SDs) (N = 5/group)—a one-way ANOVA test, followed by Dunnett’s multiple comparison analysis, were used for statistical evaluation (the significance was set at p < 0.05). (C) mRNA expression of npsa4a (marker of neuronal activity), casp3a and casp3b (markers of apoptosis). Larvae were incubated in medium containing PILO (50 mM) for 2 h. Next, larvae were thoroughly washed out × 5 times and incubated in fresh medium for subsequent 22 h. Next, samples were collected (n = 6 per group, N = 25 larvae per sample).

Acknowledgments
This image is the copyrighted work of the attributed author or publisher, and ZFIN has permission only to display this image to its users. Additional permissions should be obtained from the applicable author or publisher of the image. Full text @ Front. Mol. Neurosci.