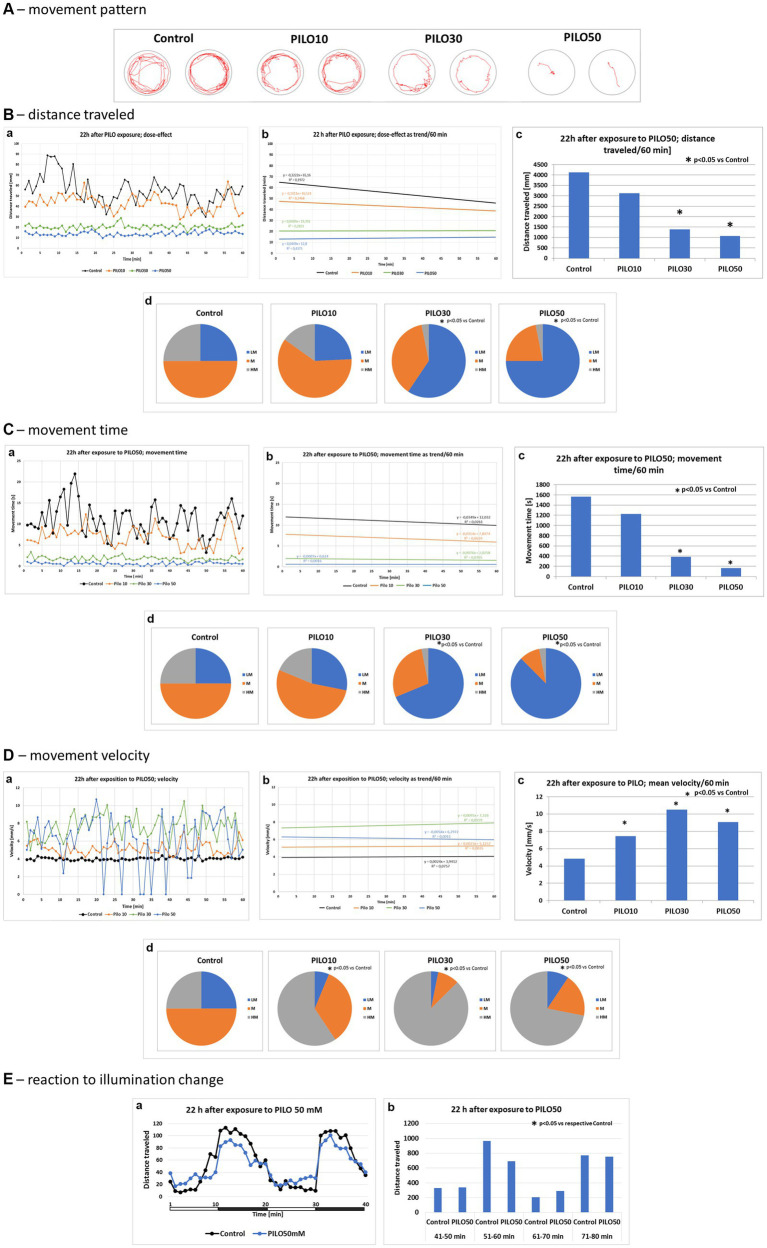
IMAGE

Figure 6

ID
ZDB-IMAGE-240822-37
Source
Figures for Gawel et al., 2024
Image
Figure Caption

Figure 6

Locomotor activity of zebrafish larvae 22 h after exposition to pilocarpine (PILO). Larvae were incubated in different concentrations of PILO (10, 30 or 50 mM) for 120 min. Next, larvae were thoroughly washed out 5 times, and incubated in fresh medium for subsequent 22 h. Afterwards, locomotor activity assay was conducted for 120 min: (A) representative track visualizations which show the manner and intensity of zebrafish larvae movement in the well area (red line)—the analysis was conducted at 9–10 min interval. (B,a) Each point represents median value of distance traveled at 1 min intervals; (b) locomotion was presented as a linear trend; the equation y = mx + c and squared value R2 are given in the graph; (c) total distance traveled in 60 min (data are presented as median values)—statistical analysis was performed using nonparametric ANOVA Kruskal–Wallis test, followed by Dunn’s Multiple Comparisons test (significance level was set at p < 0.05); (d) the pie charts show the fractions of larvae in quartiles: LM—larvae with low total mobility, M—larvae with medium total mobility, HM—larvae with high total mobility; statistical analysis was performed using chi-square (χ2) statistics (significance level was set at p < 0.05, number of subjects analyzed was N = 32 in control groups and in each PILO exposed group). (C,a) Each point represents median value of movement time registered at 1 min intervals; (b) movement time was presented as a linear trend; (c) total distance traveled in 60 min; (d) the pie charts show the fractions of larvae in quartiles; presentation of results and statistical analysis as described in (B,a). (D,a) Each point represents median value of movement velocity registered at 1 min intervals; (b) movement velocity presented as a linear trend; (c) mean movement velocity traveled in 60 min; (d) the pie charts show the fractions of larvae in quartiles: LM—larvae with low total mobility, M—larvae with moderate total mobility, HM—larvae with high total mobility; presentation of results and statistical analysis as described in (B,a). (E) Dark–light assay was conducted with following phases: 100% light–100% dark—100% light–100% dark, 10 min each: (a) each point represents median value of distance traveled at 1 min intervals; horizontal white-black bar illustrates the sequence of illumination changes, light and darkness alternately; (b) total distance traveled in 10 min intervals; horizontal white-black bar illustrates the sequence of illumination changes, light and darkness alternately (data are presented as median values)—statistical analysis was performed using nonparametric ANOVA Kruskal–Wallis test, followed by Dunn’s Multiple Comparisons test (significance level was set at p < 0.05, number of subjects analyzed was N = 16/control group and N = 32/each PILO exposed group).

Acknowledgments
This image is the copyrighted work of the attributed author or publisher, and ZFIN has permission only to display this image to its users. Additional permissions should be obtained from the applicable author or publisher of the image. Full text @ Front. Mol. Neurosci.