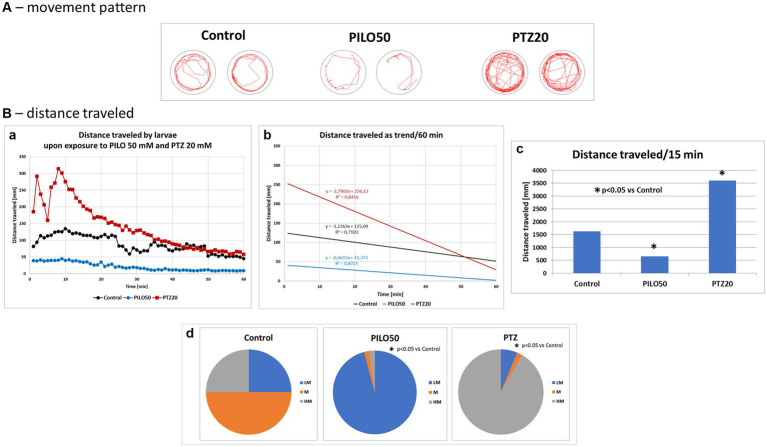
IMAGE

Figure 7

ID
ZDB-IMAGE-240822-38
Source
Figures for Gawel et al., 2024
Image
Figure Caption

Figure 7

Comparison of locomotor activity of zebrafish larvae exposed to pilocarpine (PILO) or pentylenetetrazole (PTZ). Larvae were incubated in medium containing PILO (50 mM) or PTZ (20 mM) for 5 min, and, afterwards, locomotor activity assay was conducted for 60 min at 1 min intervals: (A) representative track visualizations which show the manner and intensity of zebrafish larvae movement in the well area (red line); the analysis was conducted at 9–10 min trial, the time of highest activity of larvae exposed to PTZ. (B,a) Each point represents median value of distance traveled at 1 min intervals; (b) locomotion was presented as a linear trend—the equation y = mx + c and squared value R2 are given in the graph; (c) total distance traveled in 60 min (data are presented as median values)—statistical analysis was performed using nonparametric ANOVA Kruskal–Wallis test, followed by Dunn’s Multiple Comparisons test (significance level was set at p < 0.05); (d) the pie charts show the fractions of larvae in quartiles: LM—larvae with low total mobility, M—larvae with moderate total mobility, HM—larvae with high total mobility; statistical analysis was performed using chi-square (χ2) statistics (significance level was set at p < 0.05, number of subjects N = 48/group).

Acknowledgments
This image is the copyrighted work of the attributed author or publisher, and ZFIN has permission only to display this image to its users. Additional permissions should be obtained from the applicable author or publisher of the image. Full text @ Front. Mol. Neurosci.