
- Title
-
Establishment and comprehensive characterization of a novel dark-reared zebrafish model for myopia studies
- Authors
- Xie, J., Goodbourn, P.T., Bui, B.V., Jusuf, P.R.
- Source
- Full text @ Exp. Eye. Res.
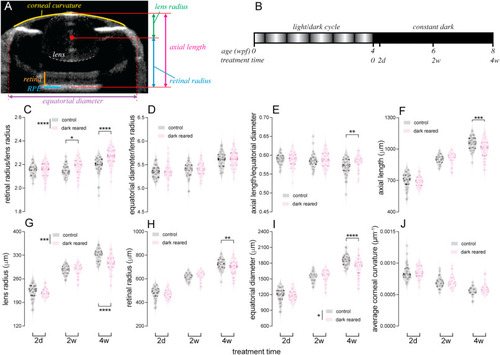
Comparison of ocular biometric parameters between control and dark-reared zebrafish. (A) Using optical coherence tomography (OCT) images of zebrafish eyes, ocular parameters including axial length, lens radius, retinal radius, equatorial diameter and corneal curvature were quantified. Lens (white dashed lines), retina (orange solid line) and retinal pigmented epithelium (RPE; light blue solid line) are highlighted in the representative image. (B) For dark-rearing, zebrafish were reared under a normal light/dark cycle until 4 weeks post-fertilization (wpf), followed by 2 days (2d), 2 weeks (2w) or 4 weeks (4w) of exposure to a constant dark environment. Controls were age-matched fish reared under normal lighting. (C–J) To analyze the impact of dark rearing, ratios of (C) retinal radius to lens radius, (D) equatorial diameter to lens radius, and (E) axial length to equatorial diameter, as well as (F) axial length, (G) lens radius, (H) retinal radius, (I) equatorial diameter and (J) averaged corneal curvature were compared between groups for each dark-rearing duration. In violin plots, dots show data for each individual retina. Thick bars indicate the median, and thin lines indicate interquartile ranges. N = 36, 40 and 40 fish per group for 2d, 2w and 4w of dark rearing, respectively. Two-way ANOVA was performed. *P < 0.05; **P < 0.01; ***P < 0.001; ****P < 0.0001. Asterisks next to the vertical bars indicate the group effect, those above or below the horizontal bracket indicate Fisher's LSD post-hoc comparisons. Given that differences between groups for the tested parameters, if any, were in relatively small ranges, for better visualization, y-axes of figures may not start from 0. (For interpretation of the references to color in this figure legend, the reader is referred to the Web version of this article.) |
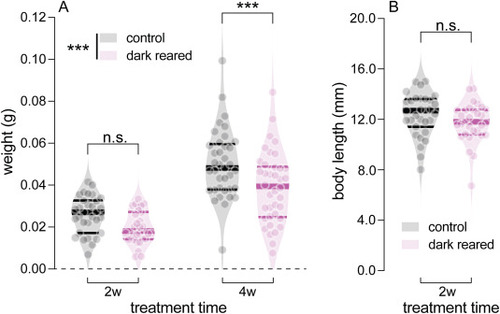
Effects of dark-rearing on body weight and length. (A) Comparison of body weight between control and dark-reared zebrafish at 2 weeks (2w) and 4 weeks (4w) post-treatment. For 2-week treated groups, there were 31 control and 30 dark-reared fish. For 4-week treated groups, there were 37 control and 38 dark-reared fish. Two-way ANOVA was performed. (B) Comparison of body length between control and dark-reared zebrafish at 2w post-treatment. There were there were 31 control and 30 dark-reared fish. An unpaired t-test was performed. Violin plots show data for individual fish. Thick bars indicate medians, and thin lines indicate interquartile ranges. ***P < 0.001; n.s.: not significant. Asterisks next to the vertical bars indicate the group effect, those above the horizontal bracket indicate Fisher’s LSD post-hoc comparisons. |
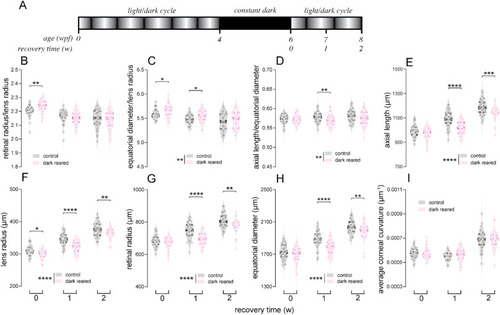
Ocular biometric parameters of control and 2-week dark-reared fish at 0, 1 and 2 weeks (w) post-recovery. (A) For rearing treatments, wild-type fish were reared under a constant dark environment for 2 weeks from 4 weeks post-fertilization (wpf), followed by recovery in normal light/dark rearing. (B–I) Parameters including (B) retinal radius to lens radius ratio, (C) equatorial diameter to lens radius ratio and (D) axial length to equatorial diameter ratio, as well as (E) axial length, (F) lens radius, (G) retinal radius, (H) equatorial diameter and (I) averaged corneal curvature, were compared between control and treated fish at 0 (baseline), 1 and 2 weeks of recovery. Violin plots show data for individual retinae with thick bars indicating medians, and thin lines indicating interquartile ranges. N = 40 control fish for each timepoint. N = 38, 40 and 37 dark-reared fish for 0, 1 and 2 w of recovery, respectively. Two-way ANOVA was performed. *P < 0.05; **P < 0.01; ***P < 0.001; ****P < 0.0001. Asterisks next to the vertical bars indicate the group effect, those above the horizontal bracket indicate Fisher's LSD post-hoc comparisons. Given that differences between groups for the tested parameters, if any, were in relatively small ranges, for better visualization, y-axes of figures may not start from 0. |
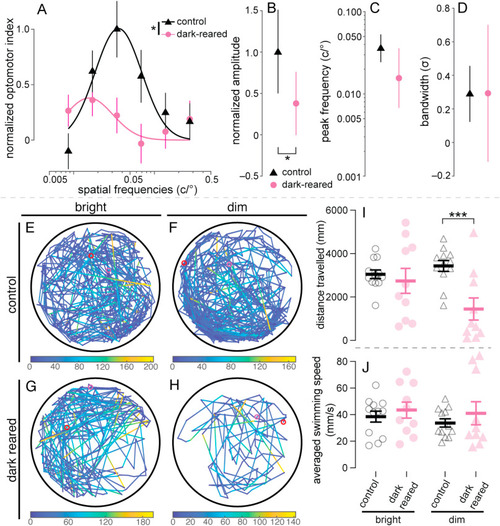
Assessment of visual behavior for control and 2-week dark-reared fish. (A–D) Spatial-frequency tuning functions were measured using optomotor responses (OMR) in control (N = 31) and 2-week dark-reared zebrafish (N = 30). (A) Spatial-frequency tuning functions are three-parameter log-Gaussian functions fit to the data by minimizing the least-square error. Error bars show ± SEM. The fitted parameters, including (B) normalized amplitude, (C) peak frequency and (D) bandwidth, were compared between groups. Error bars indicate 95% confidence intervals. Nested F-test was performed. (E–J) Locomotor responses of control and 2-week dark-reared zebrafish. (E–H) Representative 5-min swimming traces for control fish (N = 12) under bright and dim luminance (E and F, respectively), as well as dark-reared fish (N = 10) under bright and dim luminance (G and H, respectively). In each trace, the red and magenta circles indicate start and end positions, respectively. Swimming speeds during recording are color coded onto swimming traces as per the colormaps below each trace. Black circles around traces indicate the wells that contained the fish. Total distance travelled (I) and averaged swimming speeds (J) were quantified. Two-way ANOVA with Fisher's LSD was performed. For all statistics, *P < 0.05; ***P < 0.001. Asterisks next to the vertical bars indicate the group effect, those above or below the horizontal bracket indicate post-hoc comparisons. (For interpretation of the references to color in this figure legend, the reader is referred to the Web version of this article.) |
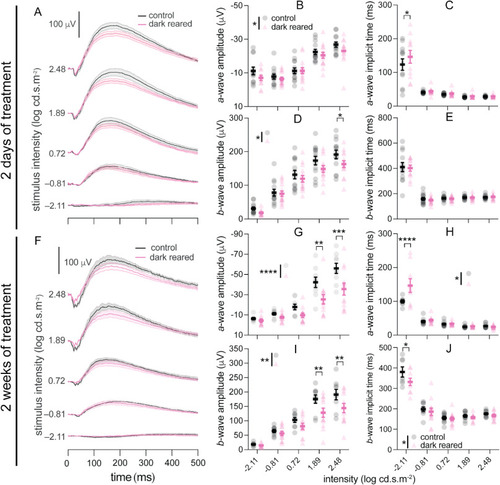
Scotopic electroretinography (ERG) of control and dark-reared fish after (A–E) 2 days and (F–J) 2 weeks of treatment. (A, F) Averaged ERG traces for control (black) and dark-reared (pink) zebrafish, at −2.11, −0.81, 0.72, 1.89, and 2.48 log cd·s·m−2. Scale bar: 100 μV. The light bands around group average traces represent ±1 SEM. The remaining panels show group average (±SEM) a-wave amplitude (B, G), a-wave implicit time (C, H), b-wave amplitude (D, I), and b-wave implicit time (E, J) for control and dark-reared fish. There were 13 control and 14 dark-reared fish for 2 days of treatment, and 9 control and 12 dark-reared fish for 2 weeks of treatment. Two-way ANOVA was performed. *P < 0.05; **P < 0.01; ***P < 0.001; ****P < 0.0001. Asterisks next to the vertical bars indicate the group effect, those above the horizontal bracket indicate Fisher's LSD post-hoc comparisons. (For interpretation of the references to color in this figure legend, the reader is referred to the Web version of this article.) |
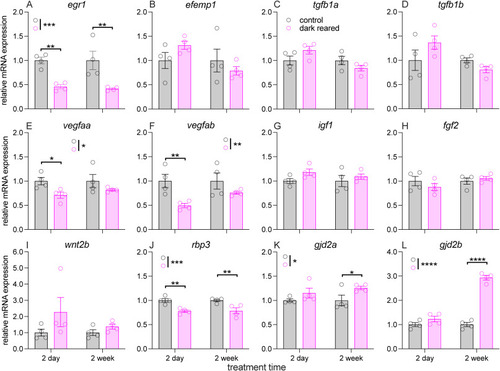
Quantitative analysis of myopia-associated genes in eyes of control and dark-reared zebrafish after 2 days and 2 weeks of treatment. (A–L) Relative mRNA expression of egr1 (A), efemp1 (B), tgfb1a (C), tgfb1b (D), vegfaa (E), vegfab (F), igf1 (G), fgf2 (H), wnt2b (I), rbp3 (J), gjd2a (K) and gjd2b (L) were examined using quantitative PCR (RT-qPCR). Error bars show ±SEM. N = 4 per group. Two-way ANOVA was performed. *P < 0.05; **P < 0.01; ****P < 0.0001. Asterisks next to the vertical bars indicate the group effect, those abovre or below the horizontal bracket indicate Fisher's LSD post-hoc comparison. |
|
Reprinted from Experimental Eye Research, 246, Xie, J., Goodbourn, P.T., Bui, B.V., Jusuf, P.R., Establishment and comprehensive characterization of a novel dark-reared zebrafish model for myopia studies, 110009, Copyright (2024) with permission from Elsevier. Full text @ Exp. Eye. Res.