
Fig. 7
- ID
- ZDB-FIG-240821-13
- Publication
- Xie et al., 2024 - Establishment and comprehensive characterization of a novel dark-reared zebrafish model for myopia studies
- Other Figures
- All Figure Page
- Back to All Figure Page
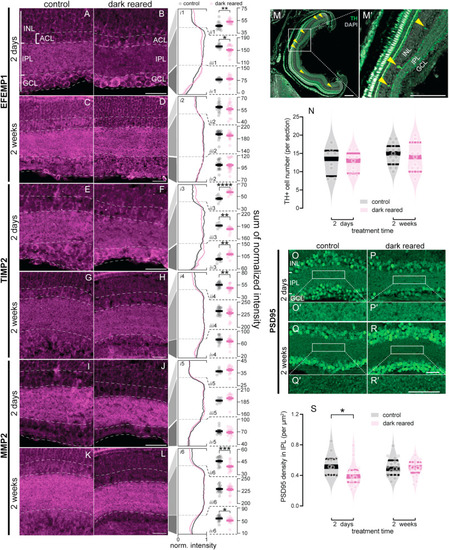
Activation of MMP2 and increased TIMP2 mRNA have been reported in myopic eyes (Guggenheim and McBrien, 1996; Jia et al., 2014, 2017). Here, our results showed that after 2 days of dark-rearing, TIMP2 expression was relatively higher in the ACL (P < 0.0001) and ganglion cell layer (GCL; P = 0.0041), but lower in the IPL (P = 0.0079; Fig. 7E–F, 7i3, ii3, iii3 and iv3). Conversely, after 2 weeks of treatment, dark-reared fish showed relatively lower TIMP2 expressed in the ACL compared to control fish (P = 0.0014), however, no change was found in the other two layers (Fig. 7G–H, 7i4, ii4, iii4 and iv4). For MMP2, there was no discernible distribution changes after 2 days dark-rearing (Fig. 7I–J, 7i5, ii5, iii5 and iv5). However, after 2 weeks of dark-rearing, there appeared to be reduced relative expression of MMP2 in the ACL (P = 0.0005) and GCL (P = 0.0390; Fig. 7K–L, 7i6, ii6, iii6 and iv6). A light-driven decrease in dopamine (or increased dopamine turnover) levels has been linked to myopia development (Landis et al., 2020; Zhou et al., 2017). As dopaminergic amacrine cells (DAC) are the main source of retinal dopamine (Hirasawa et al., 2015), DAC in zebrafish retinae were labelled by tyrosine hydroxylase (TH) and cell density was compared (Fig. 7M–M′, yellow arrowheads). There was no change in retinal DAC (or TH + cell) density in dark-reared zebrafish compared with controls (Fig. 7N). It has been shown that EGR1 inhibits post-synaptic density 95 (PSD95) transcription in response to activation of the N-Methyl-d-aspartate receptor (NMDAR) in the mouse hippocampus (Qin et al., 2015). Given the reduction of egr1 (Fig. 6A) in dark-reared zebrafish, we quantified retinal PSD95 expression, expecting PSD95 density to be increased in the IPL after dark-rearing. However, we found that after 2 days of dark-rearing, zebrafish retinae had lower PSD95 density than control fish (P = 0.0191; Fig. 7O and P′ and 7S), and after 2 weeks of dark-rearing there was no difference between groups (Fig. 7Q and R′ and 7S). Therefore, our results suggest that EGR1 regulates retinal PSD95 differently to the brain. Histological analysis of myopia-associated molecules in the dark-reared zebrafish myopia model. (A–L) EFEMP1 (A–D), TIMP2 (E–H) and MMP2 (I–L) staining in control (left column) and dark-reared retinae (right column) at 2 days (upper rows) or 2 weeks (lower rows) post-treatment. Normalized expression levels (norm. intensity) for (i1–i2) EFEMP1, (i3–i4) TIMP2 and (i5–i6) MMP2 across the inner retina in control (black traces) and dark-reared (pink traces) fish at 2 days (upper rows) or 2 weeks (lower rows) post-treatment. Normalized intensity was quantified in the (ii1–ii6) amacrine cell layer (ACL), (iii1–iii6) inner plexiform layer (IPL) and (iv1–iv6) ganglion cell layer (GCL). For EFEMP1, there were 13 control and 15 dark-reared retinae for 2 days post-treatment, and 16 retinae per group for 2 weeks post-treatment. For both TIMP2 and MMP2, there were 8 control and 11 dark-reared retinae for 2 days post-treatment, as well as 17 control and 16 dark-reared retinae for the 2-week dark-rearing timepoint. Data presented as Mean ± SEM. Unpair t-test was performed. (M) Representative image of dopaminergic amacrine cells (DAC) stained using tyrosine hydroxylase (TH) with a zoomed in region shown in (M′) with yellow arrowheads highlight DACs. (N) Number of DACs (TH+) was quantified and compared between groups after 2 days and 2 weeks of dark-rearing. For analysis of dopaminergic (or TH+) cell number, there were 8 control and 9 dark-reared retinae for 2 days post-treatment, and 15 control and 15 dark-reared retinae per group for 2 weeks post-treatment. Two-way ANOVA with Fisher's LSD post-hoc tests were performed. (O–R′) PSD95 density in the IPL of control (left column) and dark-reared retinae (right column) with 2 days (upper rows) or 2 weeks (lower rows) post-treatment, with PSD95 also shown at higher magnification (O′, P′, Q′, and R′). (S) PSD95 density in the IPL was quantified and compared between groups. For analysis of PSD95 puncta, there were 14 control and 13 dark-reared retinae for 2 days post-treatment, and 17 control and 17 dark-reared retinae for 2 weeks post-treatment. Two-way ANOVA with Fisher's LSD post-hoc tests were performed. For all violin plots, dots are data from individual retinae. Thick bars represent medians, and thin lines indicate interquartile ranges. For all statistics, *P < 0.05; **P < 0.01; ***P < 0.001; ****P < 0.0001.
|
Reprinted from Experimental Eye Research, 246, Xie, J., Goodbourn, P.T., Bui, B.V., Jusuf, P.R., Establishment and comprehensive characterization of a novel dark-reared zebrafish model for myopia studies, 110009, Copyright (2024) with permission from Elsevier. Full text @ Exp. Eye. Res.