
Fig. 6
- ID
- ZDB-FIG-240821-12
- Publication
- Xie et al., 2024 - Establishment and comprehensive characterization of a novel dark-reared zebrafish model for myopia studies
- Other Figures
- All Figure Page
- Back to All Figure Page
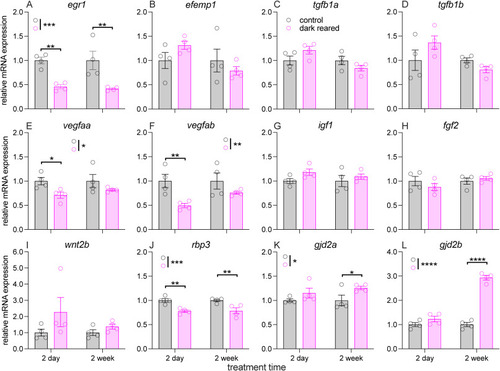
Quantitative analysis of myopia-associated genes in eyes of control and dark-reared zebrafish after 2 days and 2 weeks of treatment. (A–L) Relative mRNA expression of egr1 (A), efemp1 (B), tgfb1a (C), tgfb1b (D), vegfaa (E), vegfab (F), igf1 (G), fgf2 (H), wnt2b (I), rbp3 (J), gjd2a (K) and gjd2b (L) were examined using quantitative PCR (RT-qPCR). Error bars show ±SEM. N = 4 per group. Two-way ANOVA was performed. *P < 0.05; **P < 0.01; ****P < 0.0001. Asterisks next to the vertical bars indicate the group effect, those abovre or below the horizontal bracket indicate Fisher's LSD post-hoc comparison. |
Reprinted from Experimental Eye Research, 246, Xie, J., Goodbourn, P.T., Bui, B.V., Jusuf, P.R., Establishment and comprehensive characterization of a novel dark-reared zebrafish model for myopia studies, 110009, Copyright (2024) with permission from Elsevier. Full text @ Exp. Eye. Res.