
|
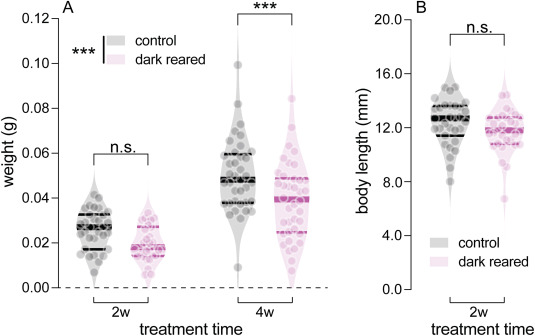
Fig. 2 Effects of dark-rearing on body weight and length. (A) Comparison of body weight between control and dark-reared zebrafish at 2 weeks (2w) and 4 weeks (4w) post-treatment. For 2-week treated groups, there were 31 control and 30 dark-reared fish. For 4-week treated groups, there were 37 control and 38 dark-reared fish. Two-way ANOVA was performed. (B) Comparison of body length between control and dark-reared zebrafish at 2w post-treatment. There were there were 31 control and 30 dark-reared fish. An unpaired t-test was performed. Violin plots show data for individual fish. Thick bars indicate medians, and thin lines indicate interquartile ranges. ***P < 0.001; n.s.: not significant. Asterisks next to the vertical bars indicate the group effect, those above the horizontal bracket indicate Fisher’s LSD post-hoc comparisons.
Reprinted from Experimental Eye Research, 246, Xie, J., Goodbourn, P.T., Bui, B.V., Jusuf, P.R., Establishment and comprehensive characterization of a novel dark-reared zebrafish model for myopia studies, 110009, Copyright (2024) with permission from Elsevier. Full text @ Exp. Eye. Res.