
Fig. 5
- ID
- ZDB-FIG-240821-11
- Publication
- Xie et al., 2024 - Establishment and comprehensive characterization of a novel dark-reared zebrafish model for myopia studies
- Other Figures
- All Figure Page
- Back to All Figure Page
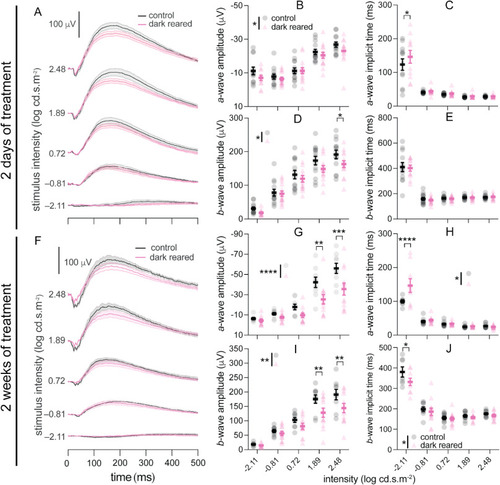
Scotopic electroretinography (ERG) of control and dark-reared fish after (A–E) 2 days and (F–J) 2 weeks of treatment. (A, F) Averaged ERG traces for control (black) and dark-reared (pink) zebrafish, at −2.11, −0.81, 0.72, 1.89, and 2.48 log cd·s·m−2. Scale bar: 100 μV. The light bands around group average traces represent ±1 SEM. The remaining panels show group average (±SEM) a-wave amplitude (B, G), a-wave implicit time (C, H), b-wave amplitude (D, I), and b-wave implicit time (E, J) for control and dark-reared fish. There were 13 control and 14 dark-reared fish for 2 days of treatment, and 9 control and 12 dark-reared fish for 2 weeks of treatment. Two-way ANOVA was performed. *P < 0.05; **P < 0.01; ***P < 0.001; ****P < 0.0001. Asterisks next to the vertical bars indicate the group effect, those above the horizontal bracket indicate Fisher's LSD post-hoc comparisons. (For interpretation of the references to color in this figure legend, the reader is referred to the Web version of this article.) |
Reprinted from Experimental Eye Research, 246, Xie, J., Goodbourn, P.T., Bui, B.V., Jusuf, P.R., Establishment and comprehensive characterization of a novel dark-reared zebrafish model for myopia studies, 110009, Copyright (2024) with permission from Elsevier. Full text @ Exp. Eye. Res.