
|
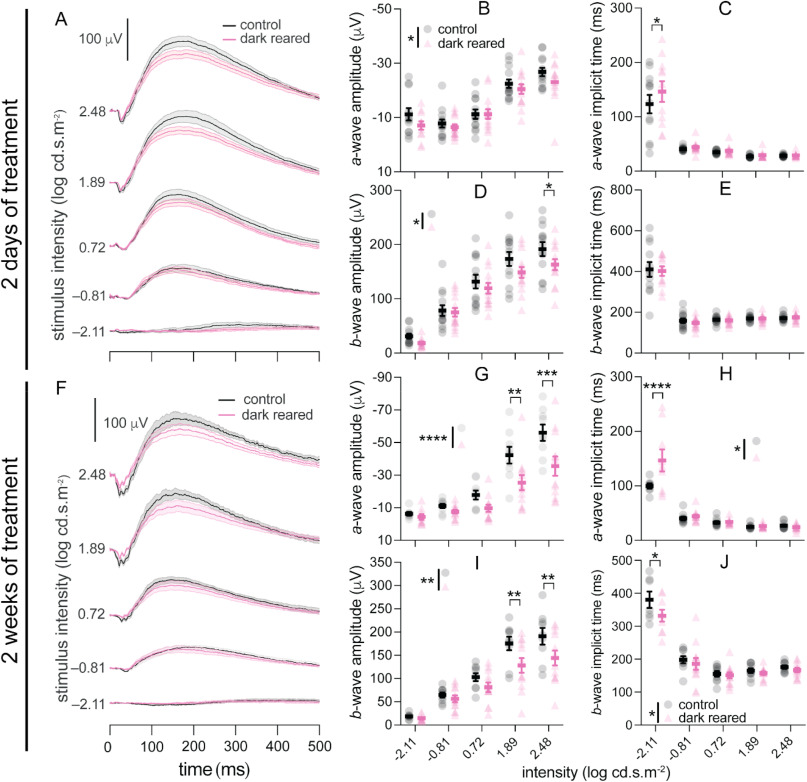
Fig. 5 Scotopic electroretinography (ERG) of control and dark-reared fish after (A–E) 2 days and (F–J) 2 weeks of treatment. (A, F) Averaged ERG traces for control (black) and dark-reared (pink) zebrafish, at −2.11, −0.81, 0.72, 1.89, and 2.48 log cd·s·m−2. Scale bar: 100 μV. The light bands around group average traces represent ±1 SEM. The remaining panels show group average (±SEM) a-wave amplitude (B, G), a-wave implicit time (C, H), b-wave amplitude (D, I), and b-wave implicit time (E, J) for control and dark-reared fish. There were 13 control and 14 dark-reared fish for 2 days of treatment, and 9 control and 12 dark-reared fish for 2 weeks of treatment. Two-way ANOVA was performed. *P < 0.05; **P < 0.01; ***P < 0.001; ****P < 0.0001. Asterisks next to the vertical bars indicate the group effect, those above the horizontal bracket indicate Fisher's LSD post-hoc comparisons. (For interpretation of the references to color in this figure legend, the reader is referred to the Web version of this article.)
Reprinted from Experimental Eye Research, 246, Xie, J., Goodbourn, P.T., Bui, B.V., Jusuf, P.R., Establishment and comprehensive characterization of a novel dark-reared zebrafish model for myopia studies, 110009, Copyright (2024) with permission from Elsevier. Full text @ Exp. Eye. Res.