FIGURE SUMMARY
Title

In Vivo Chemical Screening in Zebrafish Embryos Identified FDA-Approved Drugs That Induce Differentiation of Acute Myeloid Leukemia Cells

Authors
Wei, X., Wang, W., Yin, Q., Li, H., Ahmed, A., Ullah, R., Li, W., Jing, L.
Source
Full text @ Int. J. Mol. Sci.

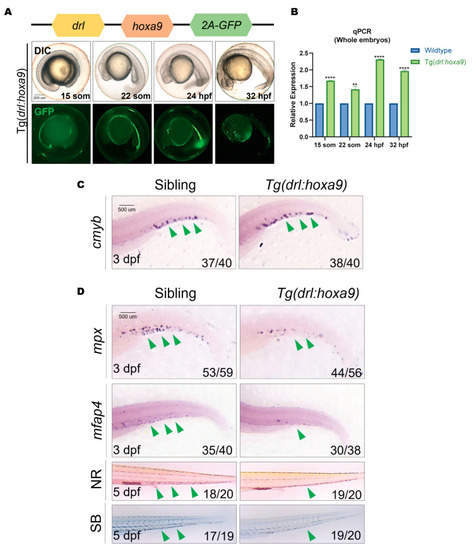
Myeloid development is arrested in Tg(drl:hoxa9) zebrafish embryos. (A) Schematic representation of the drl:hoxa9-2A-GFP reporter gene and the DIC and fluorescent images of Tg(drl:hoxa9) embryos. GFP is expressed in the lateral plate mesoderm and derived hematopoietic tissues at different stages. (B) RT-qPCR analysis of hoxa9 expression in Tg(drl:hoxa9) embryos compared to sibling embryos. Results are represented as mean ± SEM, t-test; ** p < 0.01, **** p< 0.0001. (C,D) WISH of cmyb (myeloid progenitor cells), mpx (granulocytes), and mfap4 (macrophages) in Tg(drl:hoxa9) and sibling embryos at 3 dpf. Neutral red (NR) and Sudan black (SB) staining of macrophages and neutrophils in embryos at 5 dpf. A green arrow indicates the staining signal. drl, draculin; WISH, whole mount in situ hybridization; hpf, hours post-fertilization; dpf, days post-fertilization.

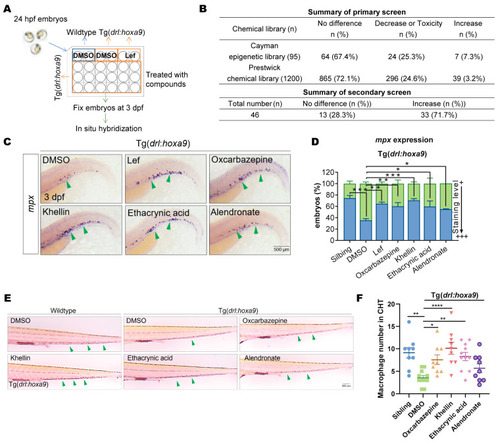
Chemical screening using Tg(drl:hoxa9) identified compounds that restored myeloid differentiation. (A) A schematic representation of the chemical screening process. The effects of compounds on myeloid differentiation were examined by WISH of mpx, and Lef was used as a positive control. (B) Summary of primary and secondary screenings. (C) Tg(drl:hoxa9) embryos were treated with DMSO; Lef; or oxcarbazepine, khellin, ethacrynic acid, and alendronate and then assayed by WISH of mpx at 3 dpf. A green arrow indicates the staining signal. (D) Quantification of WISH results in (C). (E) Sibling and Tg(drl:hoxa9) embryos were treated with DMSO, Lef, oxcarbazepine, khellin, ethacrynic acid, and alendronate and stained for macrophages with NR at 5 dpf. (F) Quantification of results in (E). Results in (D,F) are represented as mean ± SEM, t-test; * p < 0.05, ** p < 0.01, *** p < 0.001, **** p< 0.0001. NR, neutral red; Lef, leflunomide.

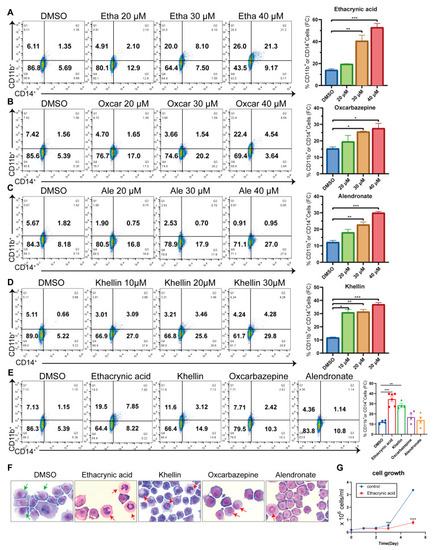
The four identified compounds induce myeloid differentiation of U937 cells. (AD) Flow cytometry analysis of CD14 and CD11b expression in U937 cells treated with different doses of ethacrynic acid, oxcarbazepine, alendronate, and khellin. (E) Flow cytometry analysis of CD14 and CD11b expression in U937 cells treated with 30 μM ethacrynic acid, oxcarbazepine, alendronate, and khellin for 3 days. (F) Representative images of May-Grunwald-Giemsa staining at 200× magnification of U937 cells treated with 30 μM chemicals for 3 days. Green arrows indicate undifferentiated cells and red arrows indicate mature cells. (G) The proliferation curve of U937 cells treated with ethacrynic acid (30 μM). Results are represented as mean ± SEM, n = 3, t-test; * p < 0.05, ** p < 0.01, *** p < 0.001, **** p< 0.0001.

Ethacrynic acid activates the IL-17/MAPK pathways during the induction of AML cell differentiation. (A) Flow cytometry analysis of CD14 and CD11b expression of U937 cells treated with ATRA (0.2 μM), ethacrynic acid, and khellin (30 μM) for 3 days. (B) Quantitative analysis of results in (A). (C,D) Flow cytometry analysis of CD1b or CD14 expression of U937 cells treated with ATRA (0.2 μM), ethacrynic acid, and khellin (30 μM) for 3 days. (E) Volcano plot of the differential gene expression between DMSO- and ethacrynic-acid-treated groups from three biological replicates. (F) Numbers of up- and downregulated genes in the ethacrynic acid group relative to the DMSO group (greater than twofold change, adj. p ≤ 0.05). (G) GO enrichment analysis of differentially expressed genes. (H) KEGG enrichment analysis of differentially expressed genes. (IM) GSEA of the expression profile of U937 cells treated with DMSO and ethacrynic acid using various signaling signatures. (N) Heatmap of DEGs involved in the IL-17 signaling pathway between the DMSO and ethacrynic acid groups. (O) RT-qPCR analysis showing mRNA expression of IL-17 B and D and IL-17 RA, RB, and RC in the ethacrynic acid group compared to the DMSO group. (P) Heatmap of DEGs involved in the IL-17/MAPK signaling pathways between the DMSO and ethacrynic acid groups. (Q) RT-qPCR analysis showing mRNA expression of FOSB, FOLS1, JUNB, JUND, MMP1, S1009A, HSPB1, HSPA8, CCL2, and MMP9 in the ethacrynic acid group compared to the DMSO group. Results in (B,O,Q) are represented as mean ± SEM, n = 3, t-test; * p < 0.05, ** p < 0.01, *** p < 0.001, **** p< 0.0001. DEG, differential gene expression.

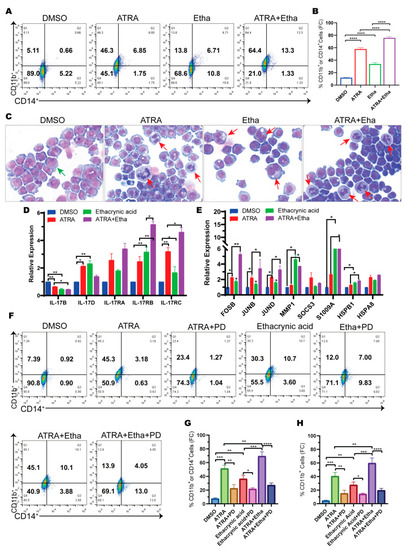
Ethacrynic acid augments ATRA-induced AML differentiation through co-activation of the IL-17/MAPK pathways. (A) Flow cytometry analysis of CD14 and CD11b expression of U937 cells treated with ATRA (0.2 μM), ethacrynic acid (30 μM), and an ATRA and ethacrynic acid combination for 3 days. (B) Quantitative analysis of results in (A). (C) Representative images of May-Grunwald-Giemsa staining at 200× magnification of U937 cells treated with ATRA (0.2 μM), ethacrynic acid (30 μM), and an ATRA and ethacrynic acid combination for 3 days. Green arrows indicate undifferentiated cells and red arrows indicate mature cells. (D) RT-qPCR analysis of IL-17 (B,D), RA, RB, and RC in the ATRA, ethacrynic acid, and ATRA plus ethacrynic acid groups compared to the DMSO group. (E) RT-qPCR analysis of genes involved in IL-17/MAPK pathways in the ATRA, ethacrynic acid, and ATRA plus ethacrynic acid groups compared to the DMSO group. (F) Flow cytometry analysis of CD14 and CD11b expression of U937 cells treated with ATRA (0.2 μM), ethacrynic acid (30 μM), and an ATRA and ethacrynic acid combination with and without PD98059 (20 μM) for 3 days. (G) Quantification of results in (F). (H) Quantification of CD11b-positive cells in each group as in (F). Results in (B,D,E,G,H) are represented as mean ± SEM, n = 3, t-test; * p < 0.05, ** p < 0.01, *** p < 0.001, **** p< 0.0001.

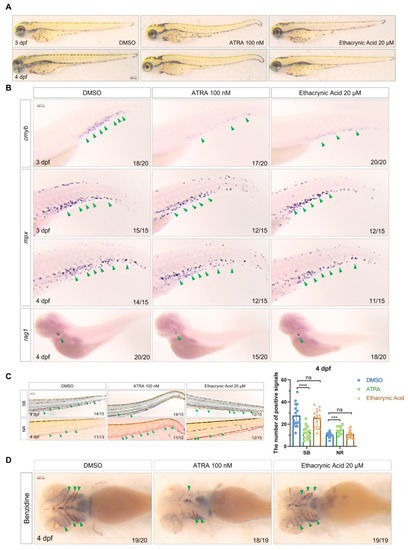
Ethacrynic acid causes less damage to normal hematopoiesis than ATRA. (A) DIC images of zebrafish WT embryos at 3 and 4 dpf after treatment with ATRA (0.1 μM) and ethacrynic acid (20 μM) at 24 hpf. (B) WISH of cmyb, mpx, and rag1 in WT embryos at 3 and 4 dpf after treatment with ATRA and ethacrynic acid at 24 hpf. A green arrow indicates the staining signal. (C) SB and NR staining of WT embryos at 4 dpf after chemical treatment. Results are represented as mean ± SEM, n = 3, t-test; *** p < 0.001, **** p < 0.0001; ns, not significant. (D) Benzidine staining of WT embryos at 4 dpf after chemical treatment. SB, Sudan black; NR, neutral red.

Acknowledgments
This image is the copyrighted work of the attributed author or publisher, and ZFIN has permission only to display this image to its users. Additional permissions should be obtained from the applicable author or publisher of the image. Full text @ Int. J. Mol. Sci.