IMAGE

Figure 3

ID
ZDB-IMAGE-240729-269
Source
Figures for Wei et al., 2024
Image
Figure Caption

Figure 3

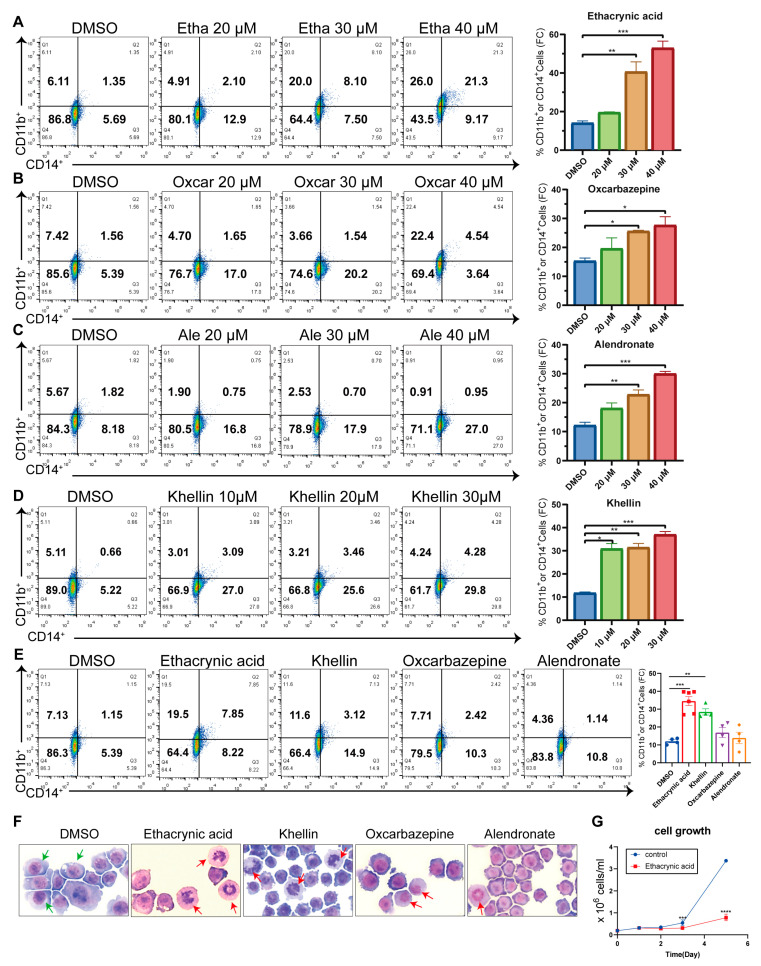
The four identified compounds induce myeloid differentiation of U937 cells. (AD) Flow cytometry analysis of CD14 and CD11b expression in U937 cells treated with different doses of ethacrynic acid, oxcarbazepine, alendronate, and khellin. (E) Flow cytometry analysis of CD14 and CD11b expression in U937 cells treated with 30 μM ethacrynic acid, oxcarbazepine, alendronate, and khellin for 3 days. (F) Representative images of May-Grunwald-Giemsa staining at 200× magnification of U937 cells treated with 30 μM chemicals for 3 days. Green arrows indicate undifferentiated cells and red arrows indicate mature cells. (G) The proliferation curve of U937 cells treated with ethacrynic acid (30 μM). Results are represented as mean ± SEM, n = 3, t-test; * p < 0.05, ** p < 0.01, *** p < 0.001, **** p< 0.0001.

Acknowledgments
This image is the copyrighted work of the attributed author or publisher, and ZFIN has permission only to display this image to its users. Additional permissions should be obtained from the applicable author or publisher of the image. Full text @ Int. J. Mol. Sci.