IMAGE

Figure 5

ID
ZDB-IMAGE-240729-271
Source
Figures for Wei et al., 2024
Image
Figure Caption

Figure 5

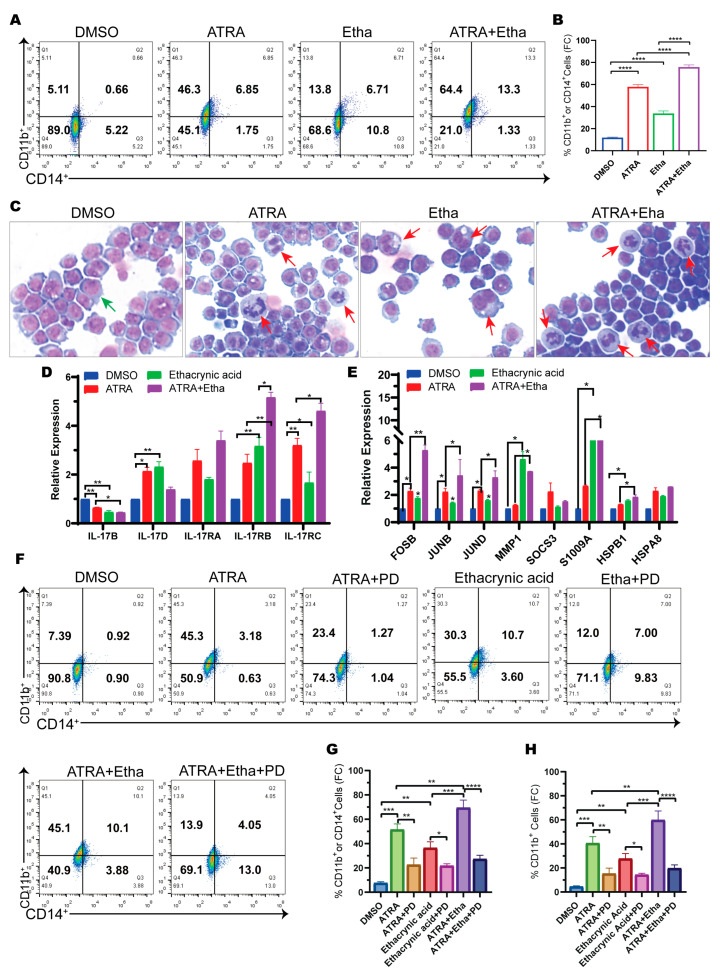
Ethacrynic acid augments ATRA-induced AML differentiation through co-activation of the IL-17/MAPK pathways. (A) Flow cytometry analysis of CD14 and CD11b expression of U937 cells treated with ATRA (0.2 μM), ethacrynic acid (30 μM), and an ATRA and ethacrynic acid combination for 3 days. (B) Quantitative analysis of results in (A). (C) Representative images of May-Grunwald-Giemsa staining at 200× magnification of U937 cells treated with ATRA (0.2 μM), ethacrynic acid (30 μM), and an ATRA and ethacrynic acid combination for 3 days. Green arrows indicate undifferentiated cells and red arrows indicate mature cells. (D) RT-qPCR analysis of IL-17 (B,D), RA, RB, and RC in the ATRA, ethacrynic acid, and ATRA plus ethacrynic acid groups compared to the DMSO group. (E) RT-qPCR analysis of genes involved in IL-17/MAPK pathways in the ATRA, ethacrynic acid, and ATRA plus ethacrynic acid groups compared to the DMSO group. (F) Flow cytometry analysis of CD14 and CD11b expression of U937 cells treated with ATRA (0.2 μM), ethacrynic acid (30 μM), and an ATRA and ethacrynic acid combination with and without PD98059 (20 μM) for 3 days. (G) Quantification of results in (F). (H) Quantification of CD11b-positive cells in each group as in (F). Results in (B,D,E,G,H) are represented as mean ± SEM, n = 3, t-test; * p < 0.05, ** p < 0.01, *** p < 0.001, **** p< 0.0001.

Acknowledgments
This image is the copyrighted work of the attributed author or publisher, and ZFIN has permission only to display this image to its users. Additional permissions should be obtained from the applicable author or publisher of the image. Full text @ Int. J. Mol. Sci.