
- Title
-
Leucine-Rich Repeat Kinase-2 Controls the Differentiation and Maturation of Oligodendrocytes in Mice and Zebrafish
- Authors
- Filippini, A., Cannone, E., Mazziotti, V., Carini, G., Mutti, V., Ravelli, C., Gennarelli, M., Schiavone, M., Russo, I.
- Source
- Full text @ Biomolecules
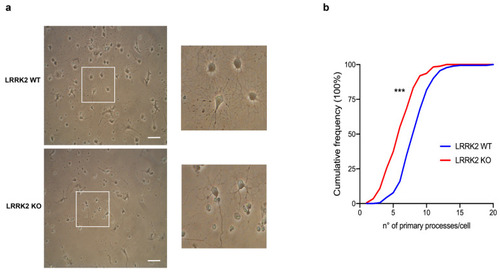
LRRK2 KO OPCs exhibited a reduced number of primary cellular processes. ( |
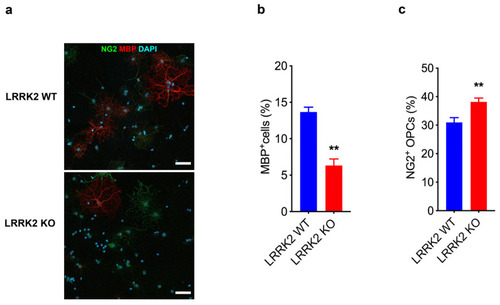
LRRK2 controls the transition of OPCs into mature OLs. ( |
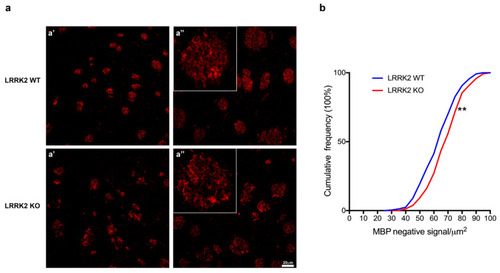
LRRK2 KO mouse brains displayed alterations of MBP+ striosomes. ( |
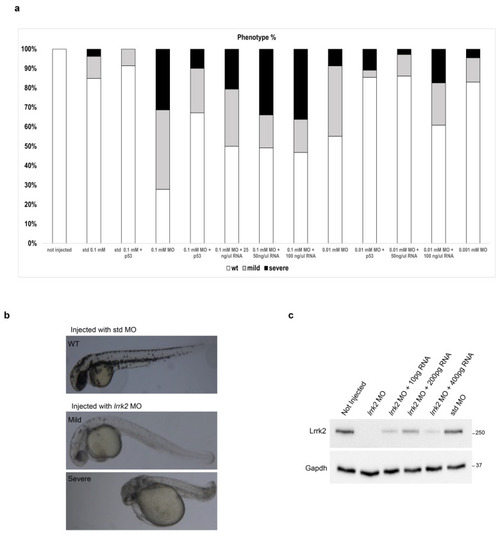
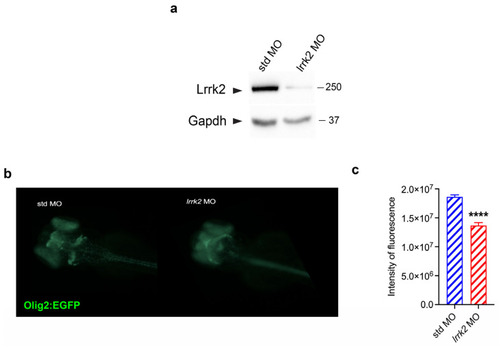
Effects of |
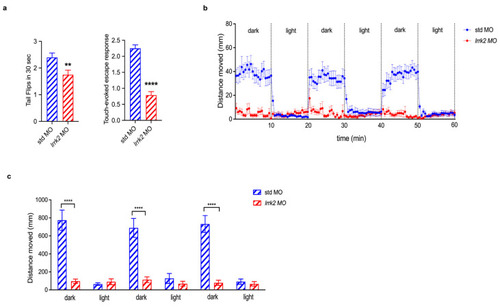
|
|
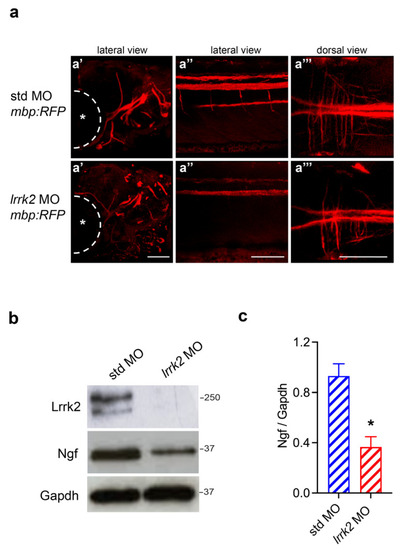
Effects of |