IMAGE

Figure 2

ID
ZDB-IMAGE-240729-252
Source
Figures for Filippini et al., 2024
Image
Figure Caption

Figure 2

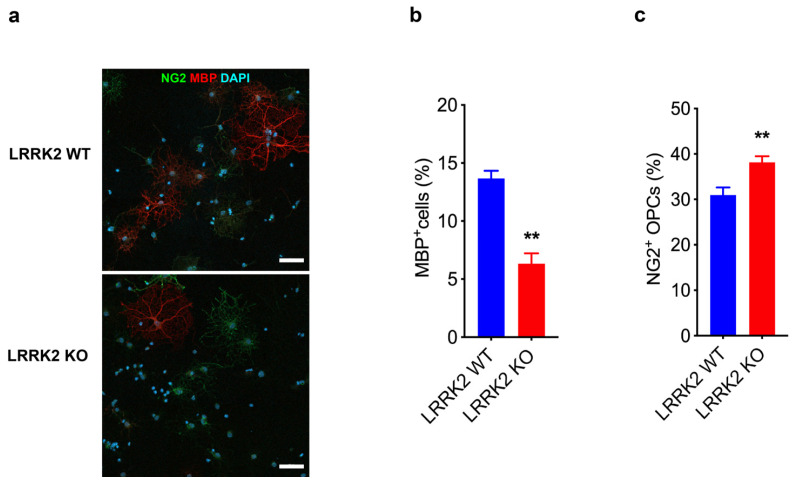
LRRK2 controls the transition of OPCs into mature OLs. (a) Representative image of the immunofluorescence staining for NG2 and MBP markers in LRRK2 WT and LRRK2 KO OPCs culture. Scale bars 50 µm. (b) Quantification of MBP+ cells in LRRK2 KO compared to WT cultures. Data are representative of three experiments performed on three different cultures and are expressed as % MPB+ cells/total cells analyzed. At least 60 cells were analyzed for each experiment. Data were analyzed using unpaired t-test, ** p = 0.003. (c) Quantification of NG2+ cells in LRRK2 KO compared to WT cultures. Data are representative of six experiments performed on two different cultures and are expressed as % NG2+ cells/total cells analyzed. At least 60 cells were analyzed for each experiment. Data were analyzed using unpaired t-test, ** p = 0.007.

Acknowledgments
This image is the copyrighted work of the attributed author or publisher, and ZFIN has permission only to display this image to its users. Additional permissions should be obtained from the applicable author or publisher of the image. Full text @ Biomolecules