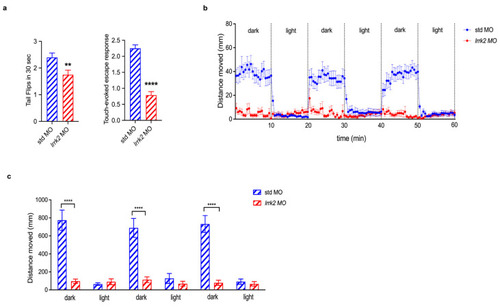
Effects of lrrk2 MO on zebrafish motor behaviors. (a) Spontaneous coiling events (tail flips) performed by wild-type zebrafish embryos injected with 0.01 mM of both control (std MO) and lrrk2 MO have been recorded at 24 hpf. Bar Graph represents the media of tail flips performed by each embryo in 30 s ± SEM (a, left panel). Touch-evoked escape response has been measured at 48 hpf on the same injected embryos. A value of 0 was attributed to completely paralyzed embryos, 1 to embryos performing only spontaneous coiling events, 2 to embryos moving short distances, and 3 to embryos swimming normally. Bar Graph reports the media of motor value for each condition ± SEM (a, right panel) Values represent the media from four independent experiments. Number of embryos analyzed for tail flip: std MO-injected (n = 90), lrrk2 MO-injected (n = 80). Number of embryos analyzed for touch-evoked escape response: std MO-injected (n = 69), lrrk2 MO-injected (n = 66). Data were analyzed by Mann–Whitney test, ** p < 0.01 and **** p < 0.0001. (b,c) Analysis of distance moved by std MO and lrrk2 MO-injected embryos under light on/light off visual stimuli has been performed at 120 hpf by using Noldus Chamber equipped with a camera recording traces of zebrafish movement and Ethovision XT software Version XT 13.0.1220 for the data analysis. Three 10 min light on/10 min light off cycles have been performed after 30 min of light habituation. (b) Traces in the graph represents the media of distance moved during time (in mm) by embryos of each condition ± SEM. (c) Bar graph reports the media of the total distance moved (in mm) by embryos of each condition ± SEM. Number of embryos analyzed: std MO-injected (n = 33); lrrk2 MO-injected (n = 29). Data were analyzed by one-way ANOVA followed by Bonferroni correction, **** p < 0.0001.
|
