
- Title
-
Investigation of Peroxisome Proliferator-Activated Receptor Genes as Requirements for Visual Startle Response Hyperactivity in Larval Zebrafish Exposed to Structurally Similar Per- and Polyfluoroalkyl Substances (PFAS)
- Authors
- Gutsfeld, S., Wehmas, L., Omoyeni, I., Schweiger, N., Leuthold, D., Michaelis, P., Howey, X.M., Gaballah, S., Herold, N., Vogs, C., Wood, C., Bertotto, L., Wu, G.M., Klüver, N., Busch, W., Scholz, S., Schor, J., Tal, T.
- Source
- Full text @ Environ. Health Perspect.
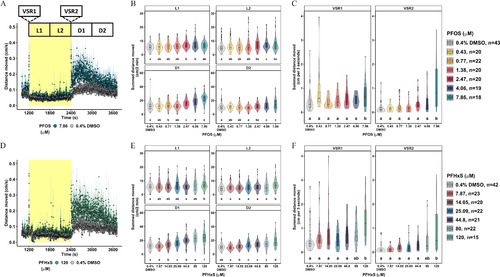
Locomotor activity assessment in 5-dpf zebrafish developmentally exposed to PFOS or PFHxS. Locomotor response following exposure to (A) 7.86μM PFOS (blue), (D) 120μM PFHxS (green), or 0.4% DMSO (gray) in the light (yellow)–dark (white) transition test. Data expressed as the mean distance moved (cm/s) ± standard error and represent 15–43 larvae per group. (B,E) Distance moved (cm) for each larva in 2-min periods across each 10-min light phase at 13,238 lux (L1, L2) and dark phase at 0 lux (D1, D2). Data are represented as box and violin plots. Violins around the box plots describe the kernel probability density of the underlying data. Significance was determined by Tukey-adjusted estimated marginal means following a generalized additive mixed effects model. Significant differences (𝑝<0.05) between groups are indicated by different letters. VSR data [within 3 s after dark–light (VSR1) or light–dark transition (VSR2)] following developmental exposure to (C) 0.43–7.86μM PFOS, or (F) 7.87–120μM PFHxS are also shown. Data are represented as box and violin plots and comprise 1 value per larva for VSR1 and VSR2. Significance was determined by Tukey-adjusted estimated marginal means following a linear mixed effects model. Significant differences (𝑝<0.05) between groups are indicated by different letters. Individual box plots comprise a box that describes the IQR, a bold line that represents the median, and whiskers that indicate the calculated minimum (25th percentile –1.5× IQR) and the calculated maximum (75th percentile +1.5× IQR). Dots represent outliers beyond the calculated minima or maxima. Violins around the box plots describe the kernel probability density of the underlying data. Replicate numbers tested for PFOS ranged from 18 to 43 larvae (C) and from 15 to 42 larvae for PFHxS (F). Summary data can be found in Excel Tables S1–S4. Note: D, dark; DMSO, dimethyl sulfoxide; dpf, days postfertilization; IQR, interquartile range; L, light; PFHxS, perfluorohexanesulfonic acid; PFOS, perfluorooctanesulfonic acid; VSR, visual startle response. |
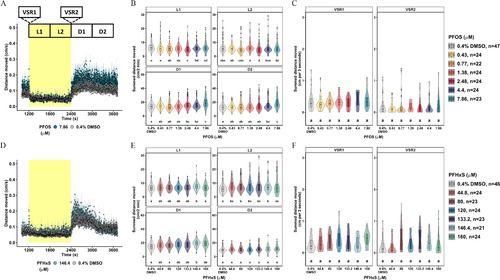
Locomotor activity assessment in 5-dpf zebrafish acutely exposed to PFOS or PFHxS. Locomotor response following acute exposure to (A) 7.86μM PFOS (blue), (D) 146.4μM PFHxS (green), or 0.4% DMSO (gray) in the light–dark transition test. Data expressed as the mean distance moved (cm/s) + standard error and represent 21–47 larvae per group. (B,E) Distance moved (cm) for each larva in 2-min periods across each 10-min light phase at 13,238 lux (L1, L2) and dark phase at 0 lux (D1, D2). Data are represented as box and violin plots comprising five values per larva in L1, L2, D1, D2. Violins around the box plots describe the kernel probability density of the underlying data. Significance was determined by Tukey-adjusted estimated marginal means following a generalized additive mixed effects model. Significant differences (𝑝<0.05) between groups are indicated by different letters. VSR data [within 3 s after dark–light (VSR1) or light–dark transition (VSR2)] following acute exposure to (C) 0.43–7.86μM PFOS, or (F) 44.8–160μM PFHxS are also shown. Data are represented as box and violin plots that comprise 1 value per larva for VSR1 and VSR2. Significance was determined by Tukey-adjusted estimated marginal means following a linear mixed effects model. Significant differences (𝑝<0.05) between groups are indicated by different letters. Individual box plots comprise a box that describes the IQR, a bold line that represents the median, and whiskers that indicate the calculated minimum (25th percentile –1.5× IQR) and the calculated maximum (75th percentile +1.5× IQR). Dots represent outliers beyond the calculated minima or maxima. Violins around the box plots describe the kernel probability density of the underlying data. Replicate numbers tested for PFOS ranged from 23 to 47 larvae (C) and from 21 to 46 larvae for PFHxS (F). Summary data can be found in Excel Tables S5–S8. Note: D, dark; DMSO, dimethyl sulfoxide; dpf, days postfertilization; IQR, interquartile range; L, light; PFHxS, perfluorohexanesulfonic acid; PFOS, perfluorooctanesulfonic acid; VSR, visual startle response. |
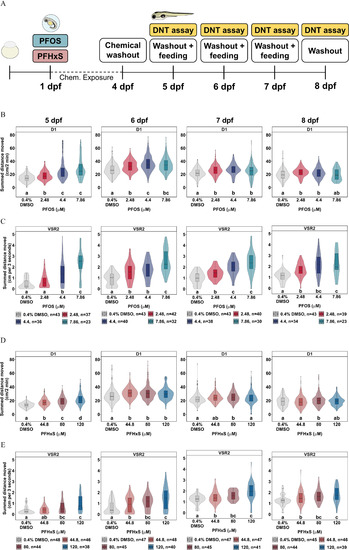
Washout study to characterize persistence of PFOS- or PFHxS-dependent dark-phase and VSR hyperactivity. (A) Experimental design of the washout study. (B,D) Distance moved (cm) for each larva in 2-min periods across each 10-min light phase at 13,238 lux (L1, L2) and dark phase at 0 lux (D1, D2) for behavior tests at 5–8 dpf. Data are represented as box and violin plots comprising 5 values per larva in the D1 phase. Violins around the box plots describe the kernel probability density of the underlying data. Significance was determined by Tukey-adjusted estimated marginal means following a generalized additive mixed effects model. Significant differences (𝑝<0.05) between groups are indicated by different letters. VSR data within 3 s after light–dark transition (VSR2) following developmental exposure to (C) 2.48–7.86μM PFOS, or (E) 44.8–120μM PFHxS are also shown for behavior tests at 5–8 dpf. Data are represented as box and violin plots that comprise 1 value per larva. Significance was determined by Tukey-adjusted estimated marginal means following a linear mixed effects model. Significant differences (𝑝<0.05) between groups are indicated by different letters. Individual box plots comprise a box that describes the IQR, a bold line that represents the median, and whiskers that indicate the calculated minimum (25th percentile –1.5× IQR) and the calculated maximum (75th percentile +1.5× IQR). Dots represent outliers beyond the calculated minima or maxima. Violins around the box plots describe the kernel probability density of the underlying data. Replicate numbers tested for PFOS ranged from 23 to 43 larvae (B,C) and from 38 to 48 larvae for PFHxS (D,E). Summary data can be found in Excel Tables S9–S12. Note: Chem, chemical; D, dark; DMSO, dimethyl sulfoxide; DNT, developmental neurotoxicity; dpf, days postfertilization; IQR, interquartile range; L, light; PFHxS, perfluorohexanesulfonic acid; PFOS, perfluorooctanesulfonic acid; VSR, visual startle response. |
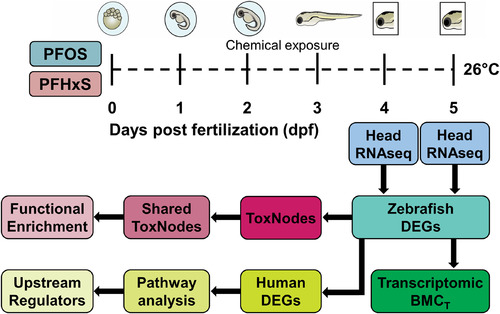
Experimental design for exploratory RNA-seq. Head dissections of PFOS (0.88μM, 1.57μM, 2.8μM) or PFHxS (7.87μM, 14μM, 25.1μM)-exposed larvae were conducted on 4–5 dpf for RNA-seq with five biological replicates per condition. Differentially expressed genes (DEGs) were used for functional enrichment analysis using ToxNodes in SOM-format, calculation of transcriptomic benchmark concentrations (BMCT), and upstream regulator predictions via an Ingenuity Pathway Analysis. Note: dpf, days postfertilization; PFHxS, perfluorohexanesulfonic acid; PFOS, perfluorooctanesulfonic acid; RNA-seq, RNA sequencing; SOM, self-organizing map. |
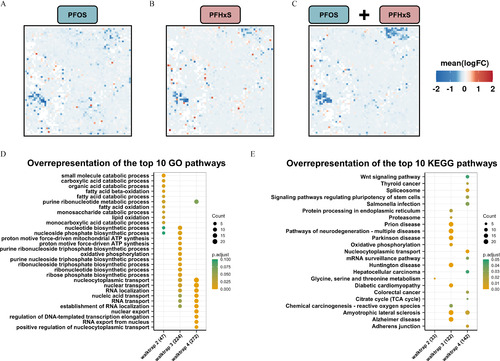
Global gene expression patterns and altered pathways in head tissue obtained from zebrafish developmentally exposed to PFOS or PFHxS. (A,B,C) Significantly enriched gene nodes at 5 dpf following exposure to (A) PFOS or (B) PFHxS, or (C) the combined dataset were projected onto a self-organizing map (SOM). Individual concentrations were combined for each substance and a single SOM was calculated with a treatment vs. control contrast. (See Figure S4 for 4-dpf SOMs.) Mean logarithmic fold changes (FCs) per node are shown. (D) Overrepresentation analysis of the top 10 Gene Ontology (GO) pathways based on differentially expressed genes (DEGs) identified for each functional group (i.e., walktrap) for the combined 5-dpf dataset. (E) Overrepresentation analysis of the top 10 KEGG pathways based on DEGs per walktrap. Numbers in brackets indicate the total number of genes assigned to each walktrap. The number of genes per pathway (count) and significance levels (p.adjust) are shown. Five biological replicates containing pools of 15 heads were used. RNA-seq data shown here can be found in Excel Tables S13–S18. Note: ATP, adenosine triphosphate; dpf, days postfertilization; GO, Gene Ontology; KEGG, Kyoto Encyclopedia of Genes and Genomes; PFHxS, perfluorohexanesulfonic acid; PFOS, perfluorooctanesulfonic acid; RNA-seq, RNA sequencing; TCA, tricarboxylic acid. Go to Figure Open |
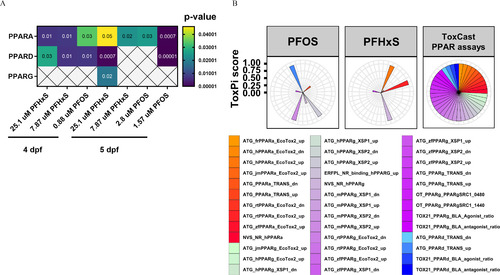
Predicted upstream regulators affected by developmental exposure to PFOS or PFHxS and in vitro potency profiles. (A) Human orthologs for zebrafish differentially expressed genes (DEGs) were analyzed by Ingenuity Pathway Analysis and predicted human PPARα, PPARδ, and PPARγ as putative upstream regulators for multiple concentrations of PFOS and PFHxS at 4–5 dpf. Significant enrichment was identified by Fisher’s exact test 𝑝<0.05; crosses indicate nonsignificance. Five biological replicates containing pools of 15 heads were used. (B) Visualized potency profiles of PFOS and PFHxS in US EPA CompTox (version 3.5) in vitro assays targeting human (h), rat (r), mouse (m), zebrafish (zf), or Japanese medaka (jm) PPARα, PPARδ, and/or PPARγ. Profiles for both chemicals were calculated based on AC50-values using the ToxPi framework. Distance from the center indicates potency. All assays were weighted equally. ToxPi data can be found in Excel Table S19. Note: AC50, 50% activity concentration; dpf, days postfertilization; EPA, Environmental Protection Agency; PFHxS, perfluorohexanesulfonic acid; PFOS, perfluorooctanesulfonic acid; PPAR, peroxisome proliferator-activated receptor; ToxPi, toxicity prioritization index. |
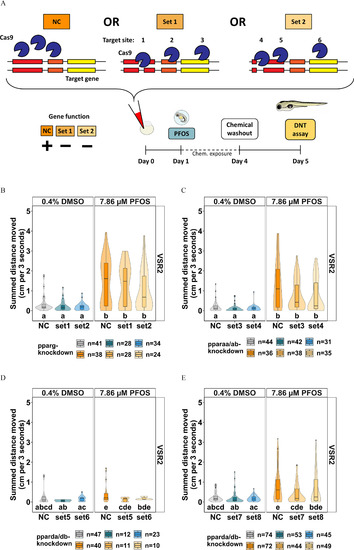
Knockdown study to determine the essentiality of ppar genes for VSR hyperactivity in PFOS-exposed zebrafish. (A) CRISPR/Cas9-based gene editing experimental design were embryos that experience gene knockdown (set 1 or set 2 crispants) relative to negative control crispants (NC) that did not experience gene knockdown and were subsequently exposed to 7.86μM PFOS at 1 dpf. The chemical was removed at 4 dpf and behavior was assessed at 5 dpf. VSR within 3 s after light–dark transition (VSR2) in (B) pparg-knockdown, (C) pparaa/ab-knockdown, or (D,E) pparda/db-knockdown larvae exposed to 7.86μM PFOS are shown. Data are represented as box and violin plots and comprise 1 value per larva. Significance was determined by Tukey-adjusted estimated marginal means following a linear mixed effects model. Significant differences (𝑝<0.05) between groups are indicated by different letters. Individual box plots comprise a box that describes the IQR, a bold line that represents the median, and whiskers that indicate the calculated minimum (25th percentile –1.5× IQR) and the calculated maximum (75th percentile +1.5× IQR). Dots represent outliers beyond the calculated minima or maxima. Violins around the box plots describe the kernel probability density of the underlying data. Replicate numbers were 24–41 for pparg-knockdown (B), 31–44 for pparaa/ab-knockdown (C), 10–47 for initial pparda/db-knockdown, and 44–75 for pparda/db-knockdown with revised guide sets. Summary data can be found in Excel Tables S20–S23. Note: CRISPR, Clustered Regularly Interspaced Short Palindromic Repeats; DNT, developmental neurotoxicity; dpf, days postfertilization; IQR, interquartile range; PFOS, perfluorooctanesulfonic acid; ppar, peroxisome proliferator-activated receptor; VSR, visual startle response. |

Coexposure of pparda/db-antagonist GSK3787 and PFOS. To mimic the CRISPR study design, embryos were exposed to 9.25 or 27.2μM of the ppard antagonist GSK3787 or 0.4% DMSO at 0 dpf. At 1 dpf, embryos were exposed to 7.86 or 11.72μM PFOS or DMSO, the chemical was removed at 4 dpf, and behavior was assessed at 5 dpf. Data shown for VSR within 3 s after light–dark transition (VSR2) are represented as box and violin plots and comprise 1 value per larva. Significance was determined by Tukey-adjusted estimated marginal means following a linear mixed effects model. Significant differences (𝑝<0.05) between groups are indicated by different letters. Individual box plots comprise a box that describes the IQR, a bold line that represents the median, and whiskers that indicate the calculated minimum (25th percentile –1.5× IQR) and the calculated maximum (75th percentile +1.5× IQR). Dots represent outliers beyond the calculated minima or maxima. Violins around the box plots describe the kernel probability density of the underlying data. Replicate numbers ranged from 16 to 55 larvae. Summary data can be found in Excel Table S24. Note: CRISPR, Clustered Regularly Interspaced Short Palindromic Repeats; DMSO, dimethyl sulfoxide; dpf, days postfertilization; GSK3787, ppard antagonist; IQR, interquartile range; PFOS, perfluorooctanesulfonic acid; VSR, visual startle response. |