
|
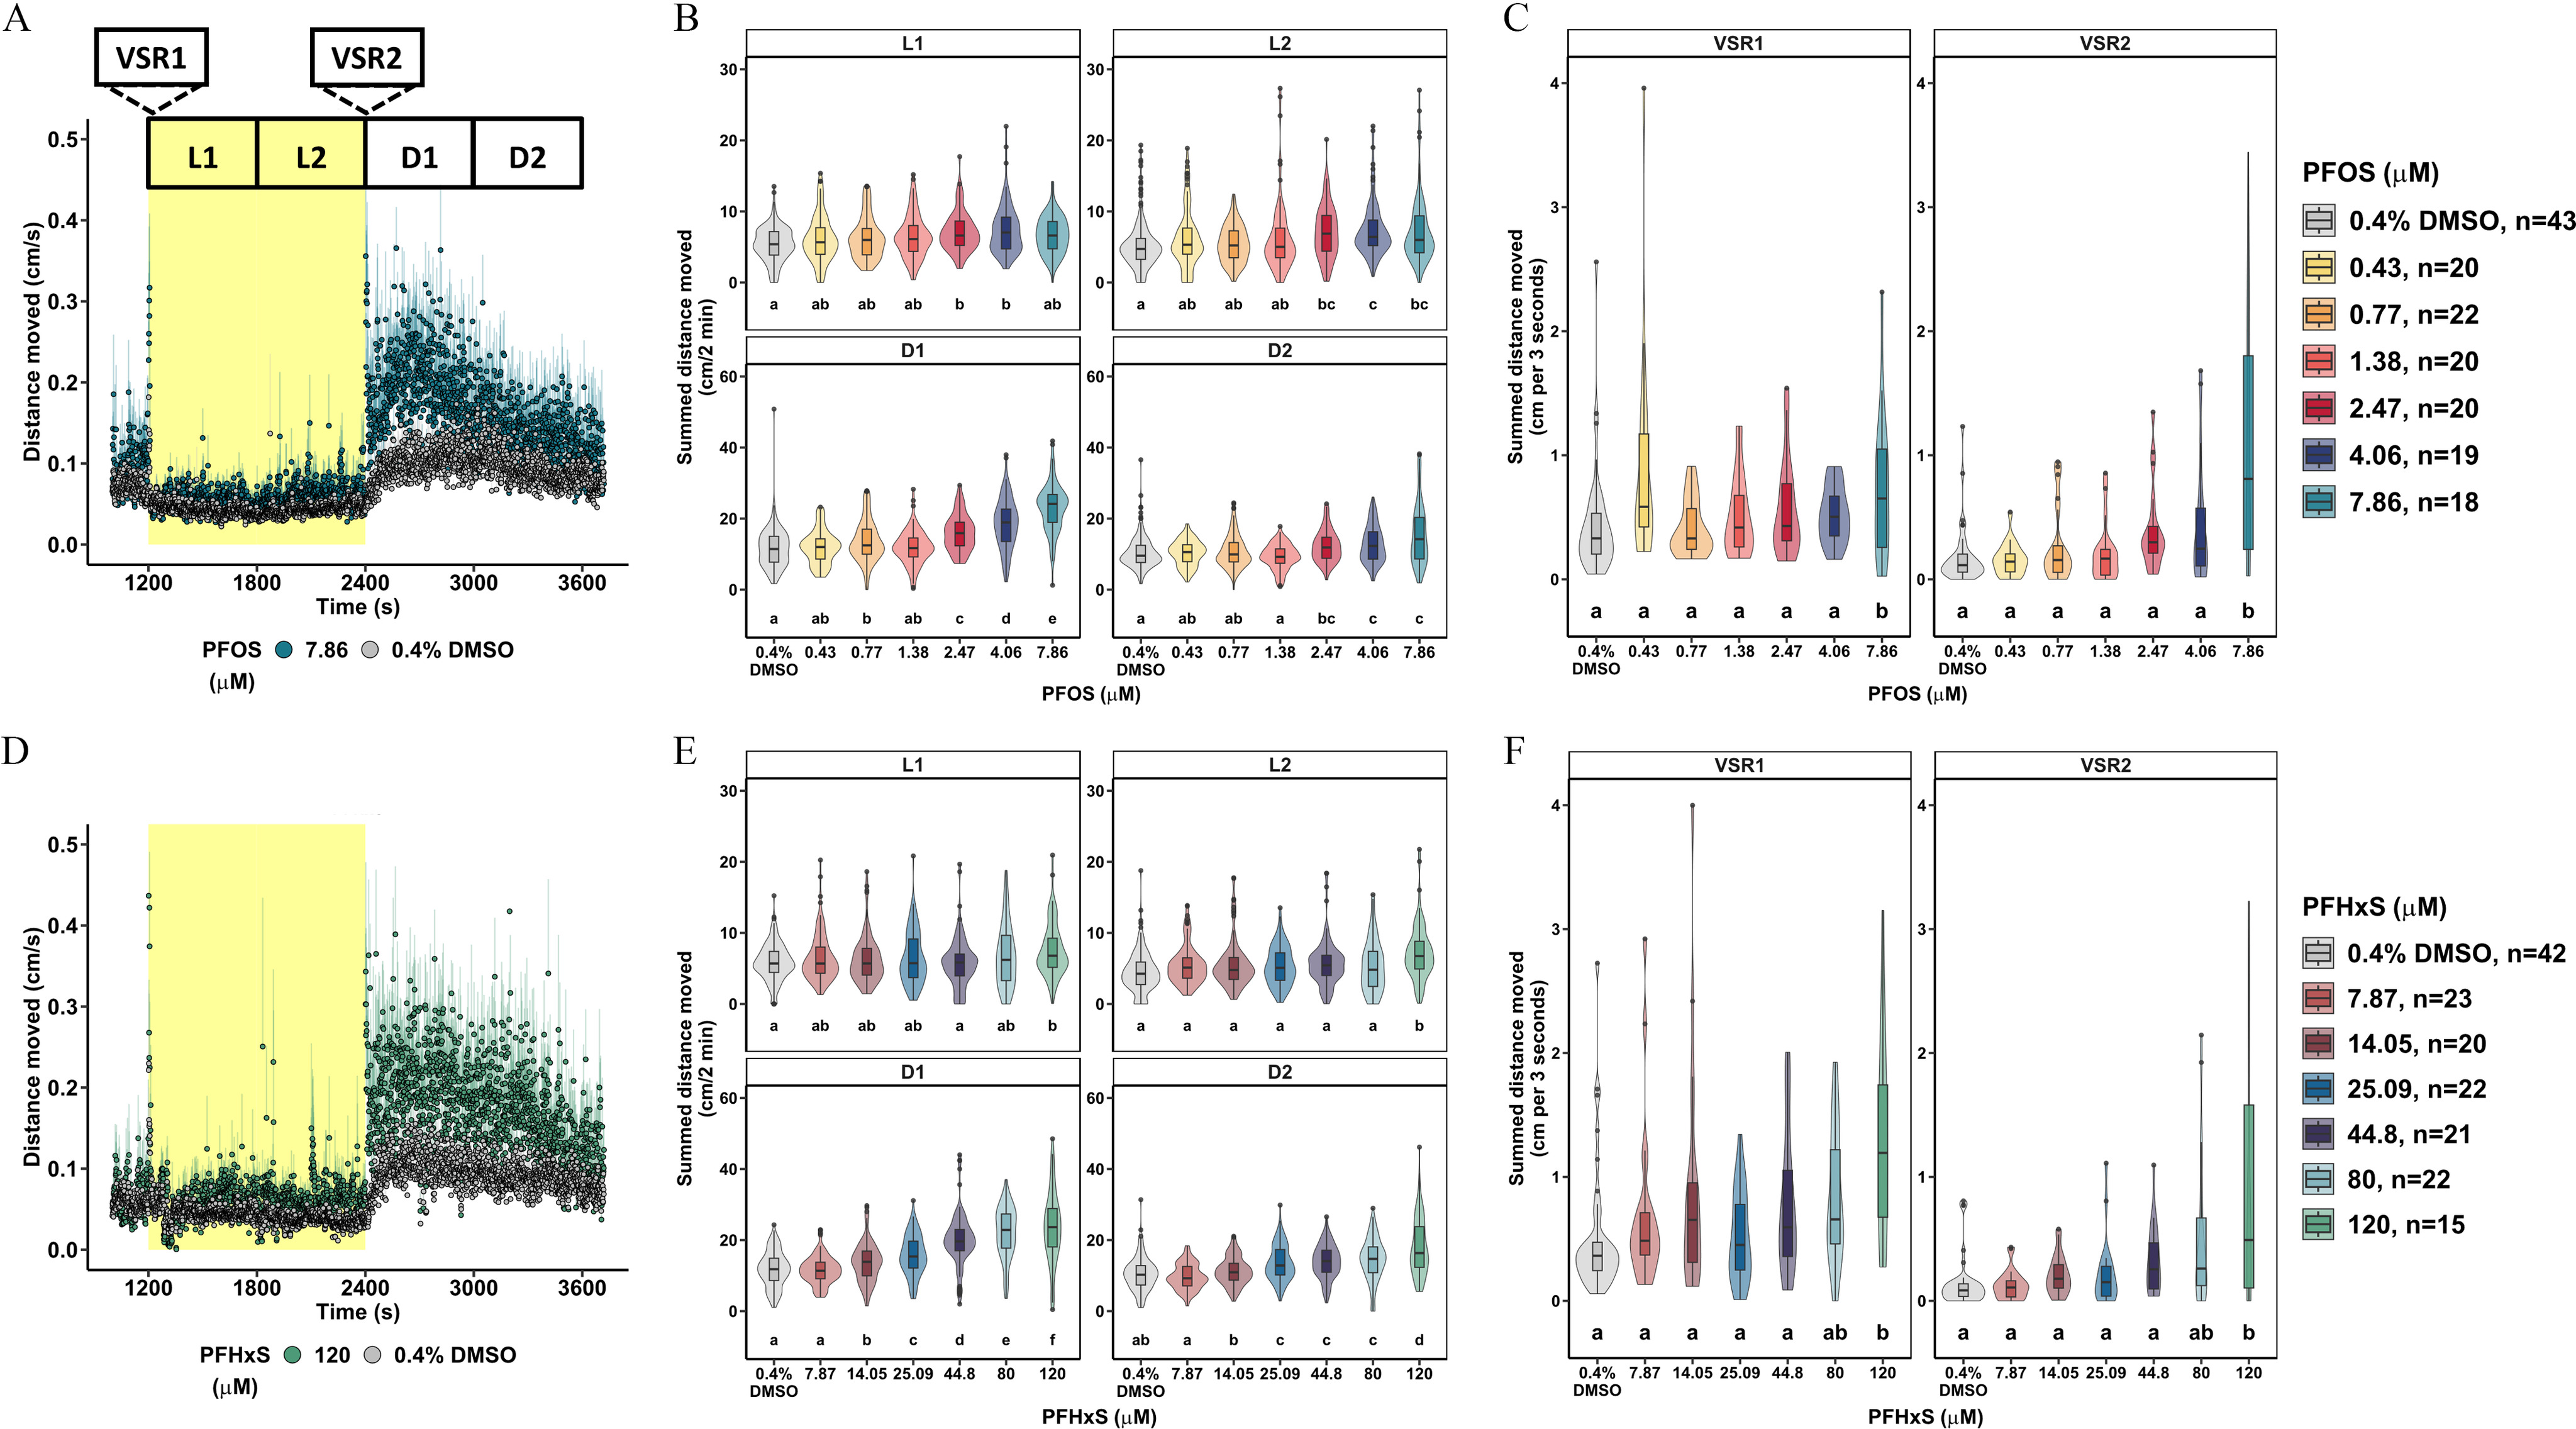
Fig. 1 Locomotor activity assessment in 5-dpf zebrafish developmentally exposed to PFOS or PFHxS. Locomotor response following exposure to (A) 7.86μM PFOS (blue), (D) 120μM PFHxS (green), or 0.4% DMSO (gray) in the light (yellow)–dark (white) transition test. Data expressed as the mean distance moved (cm/s) ± standard error and represent 15–43 larvae per group. (B,E) Distance moved (cm) for each larva in 2-min periods across each 10-min light phase at 13,238 lux (L1, L2) and dark phase at 0 lux (D1, D2). Data are represented as box and violin plots. Violins around the box plots describe the kernel probability density of the underlying data. Significance was determined by Tukey-adjusted estimated marginal means following a generalized additive mixed effects model. Significant differences (𝑝<0.05) between groups are indicated by different letters. VSR data [within 3 s after dark–light (VSR1) or light–dark transition (VSR2)] following developmental exposure to (C) 0.43–7.86μM PFOS, or (F) 7.87–120μM PFHxS are also shown. Data are represented as box and violin plots and comprise 1 value per larva for VSR1 and VSR2. Significance was determined by Tukey-adjusted estimated marginal means following a linear mixed effects model. Significant differences (𝑝<0.05) between groups are indicated by different letters. Individual box plots comprise a box that describes the IQR, a bold line that represents the median, and whiskers that indicate the calculated minimum (25th percentile –1.5× IQR) and the calculated maximum (75th percentile +1.5× IQR). Dots represent outliers beyond the calculated minima or maxima. Violins around the box plots describe the kernel probability density of the underlying data. Replicate numbers tested for PFOS ranged from 18 to 43 larvae (C) and from 15 to 42 larvae for PFHxS (F). Summary data can be found in Excel Tables S1–S4. Note: D, dark; DMSO, dimethyl sulfoxide; dpf, days postfertilization; IQR, interquartile range; L, light; PFHxS, perfluorohexanesulfonic acid; PFOS, perfluorooctanesulfonic acid; VSR, visual startle response.