
Fig. 3
- ID
- ZDB-FIG-240725-22
- Publication
- Gutsfeld et al., 2024 - Investigation of Peroxisome Proliferator-Activated Receptor Genes as Requirements for Visual Startle Response Hyperactivity in Larval Zebrafish Exposed to Structurally Similar Per- and Polyfluoroalkyl Substances (PFAS)
- Other Figures
- All Figure Page
- Back to All Figure Page
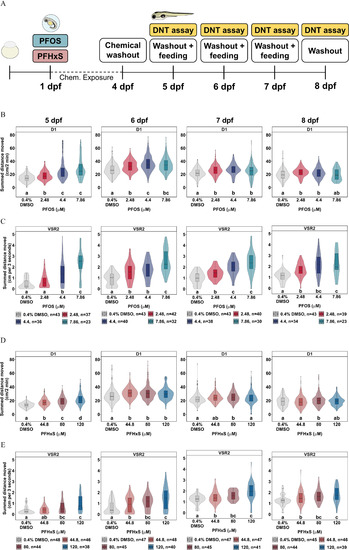
Washout study to characterize persistence of PFOS- or PFHxS-dependent dark-phase and VSR hyperactivity. (A) Experimental design of the washout study. (B,D) Distance moved (cm) for each larva in 2-min periods across each 10-min light phase at 13,238 lux (L1, L2) and dark phase at 0 lux (D1, D2) for behavior tests at 5–8 dpf. Data are represented as box and violin plots comprising 5 values per larva in the D1 phase. Violins around the box plots describe the kernel probability density of the underlying data. Significance was determined by Tukey-adjusted estimated marginal means following a generalized additive mixed effects model. Significant differences (𝑝<0.05) between groups are indicated by different letters. VSR data within 3 s after light–dark transition (VSR2) following developmental exposure to (C) 2.48–7.86μM PFOS, or (E) 44.8–120μM PFHxS are also shown for behavior tests at 5–8 dpf. Data are represented as box and violin plots that comprise 1 value per larva. Significance was determined by Tukey-adjusted estimated marginal means following a linear mixed effects model. Significant differences (𝑝<0.05) between groups are indicated by different letters. Individual box plots comprise a box that describes the IQR, a bold line that represents the median, and whiskers that indicate the calculated minimum (25th percentile –1.5× IQR) and the calculated maximum (75th percentile +1.5× IQR). Dots represent outliers beyond the calculated minima or maxima. Violins around the box plots describe the kernel probability density of the underlying data. Replicate numbers tested for PFOS ranged from 23 to 43 larvae (B,C) and from 38 to 48 larvae for PFHxS (D,E). Summary data can be found in Excel Tables S9–S12. Note: Chem, chemical; D, dark; DMSO, dimethyl sulfoxide; DNT, developmental neurotoxicity; dpf, days postfertilization; IQR, interquartile range; L, light; PFHxS, perfluorohexanesulfonic acid; PFOS, perfluorooctanesulfonic acid; VSR, visual startle response. |