
|
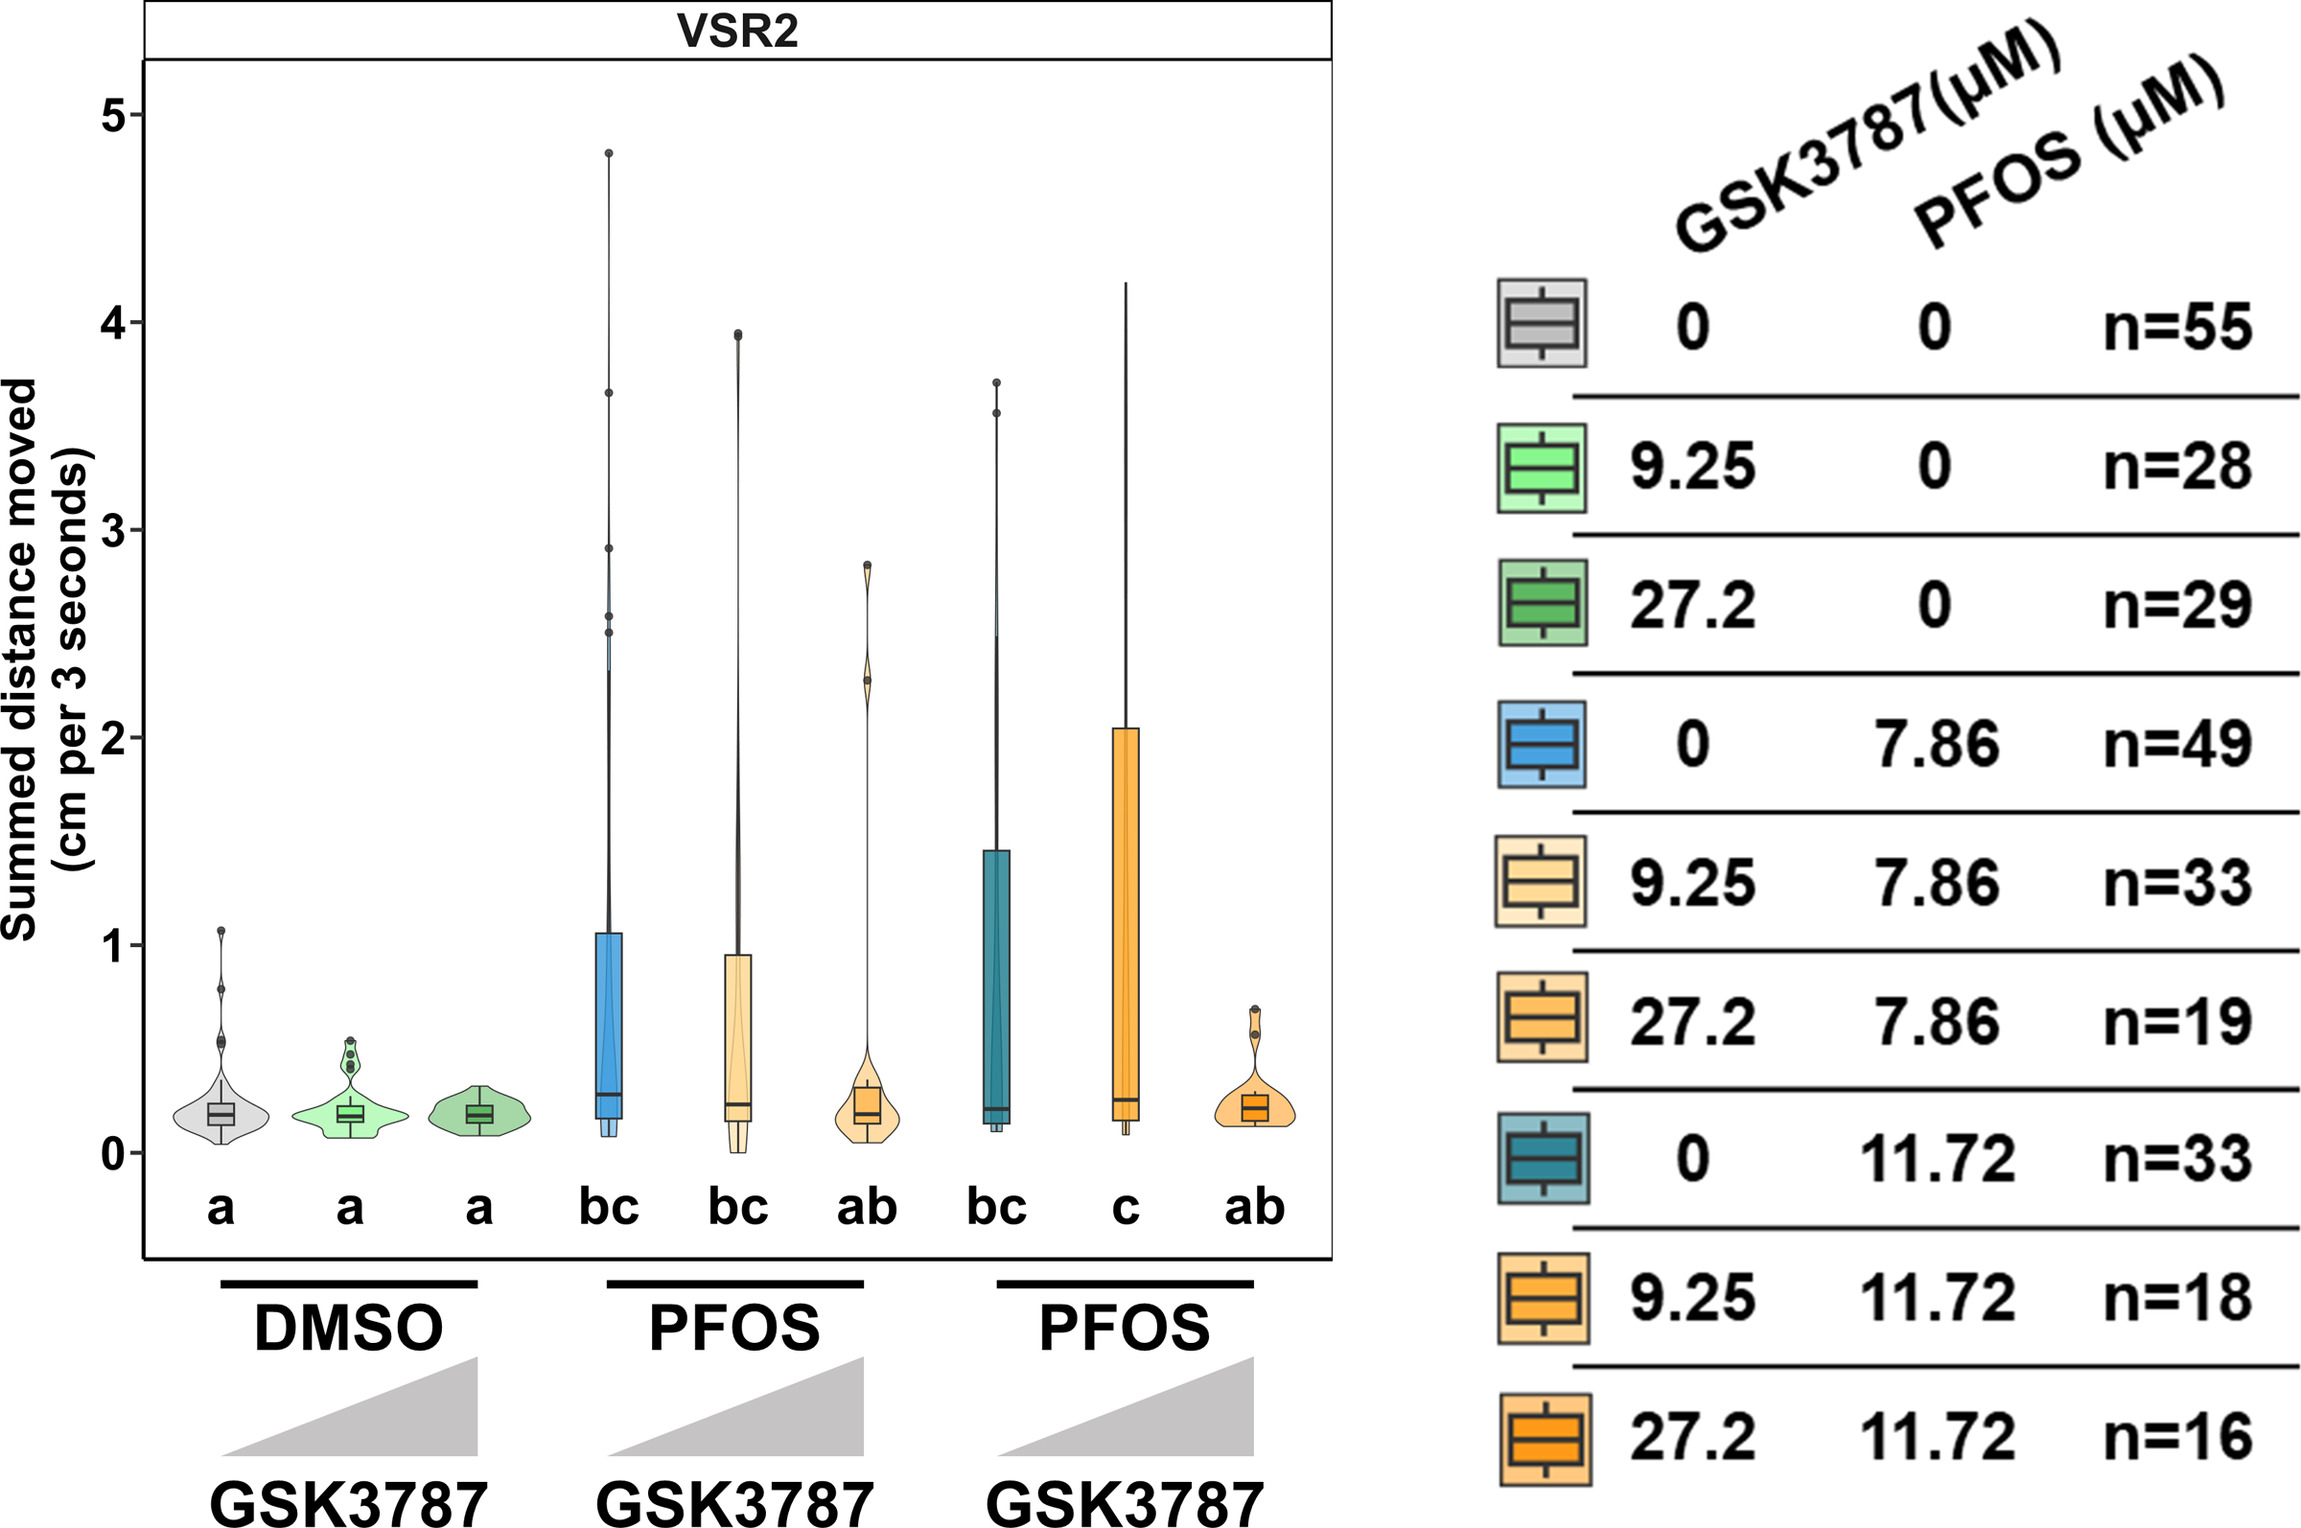
Fig. 8 Coexposure of pparda/db-antagonist GSK3787 and PFOS. To mimic the CRISPR study design, embryos were exposed to 9.25 or 27.2μM of the ppard antagonist GSK3787 or 0.4% DMSO at 0 dpf. At 1 dpf, embryos were exposed to 7.86 or 11.72μM PFOS or DMSO, the chemical was removed at 4 dpf, and behavior was assessed at 5 dpf. Data shown for VSR within 3 s after light–dark transition (VSR2) are represented as box and violin plots and comprise 1 value per larva. Significance was determined by Tukey-adjusted estimated marginal means following a linear mixed effects model. Significant differences (𝑝<0.05) between groups are indicated by different letters. Individual box plots comprise a box that describes the IQR, a bold line that represents the median, and whiskers that indicate the calculated minimum (25th percentile –1.5× IQR) and the calculated maximum (75th percentile +1.5× IQR). Dots represent outliers beyond the calculated minima or maxima. Violins around the box plots describe the kernel probability density of the underlying data. Replicate numbers ranged from 16 to 55 larvae. Summary data can be found in Excel Table S24. Note: CRISPR, Clustered Regularly Interspaced Short Palindromic Repeats; DMSO, dimethyl sulfoxide; dpf, days postfertilization; GSK3787, ppard antagonist; IQR, interquartile range; PFOS, perfluorooctanesulfonic acid; VSR, visual startle response.