
|
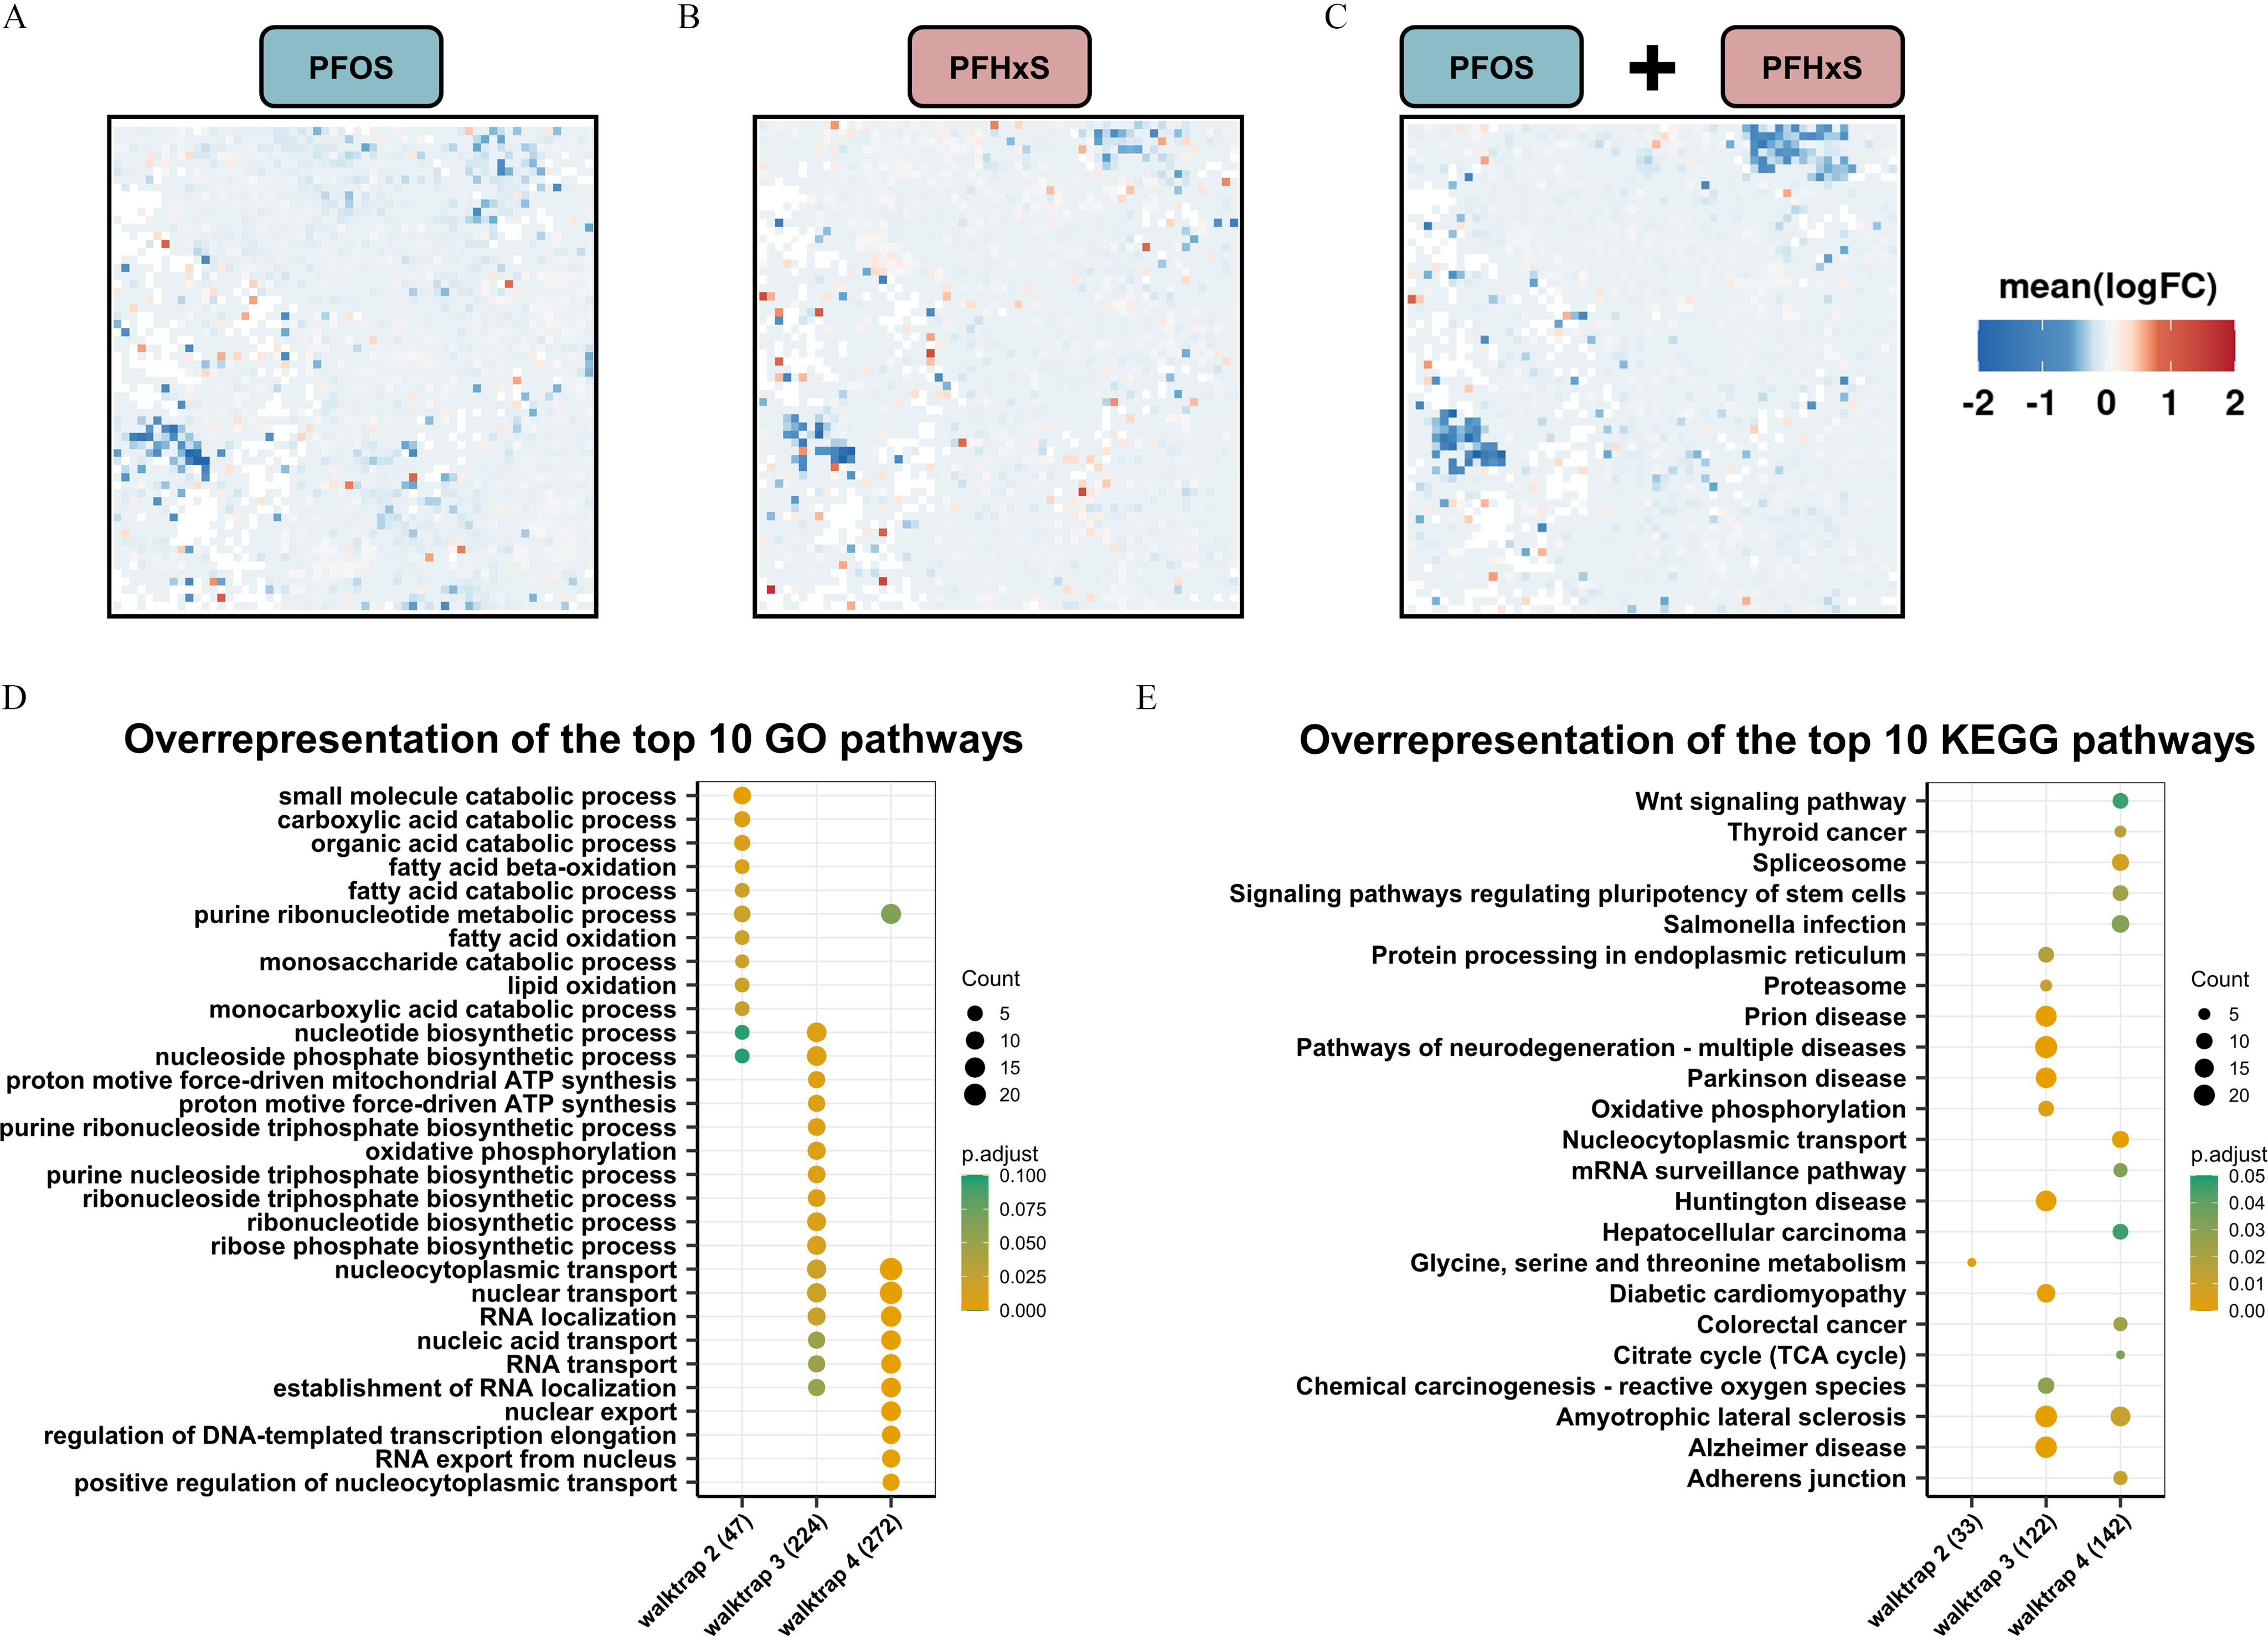
Fig. 5 Global gene expression patterns and altered pathways in head tissue obtained from zebrafish developmentally exposed to PFOS or PFHxS. (A,B,C) Significantly enriched gene nodes at 5 dpf following exposure to (A) PFOS or (B) PFHxS, or (C) the combined dataset were projected onto a self-organizing map (SOM). Individual concentrations were combined for each substance and a single SOM was calculated with a treatment vs. control contrast. (See Figure S4 for 4-dpf SOMs.) Mean logarithmic fold changes (FCs) per node are shown. (D) Overrepresentation analysis of the top 10 Gene Ontology (GO) pathways based on differentially expressed genes (DEGs) identified for each functional group (i.e., walktrap) for the combined 5-dpf dataset. (E) Overrepresentation analysis of the top 10 KEGG pathways based on DEGs per walktrap. Numbers in brackets indicate the total number of genes assigned to each walktrap. The number of genes per pathway (count) and significance levels (p.adjust) are shown. Five biological replicates containing pools of 15 heads were used. RNA-seq data shown here can be found in Excel Tables S13–S18. Note: ATP, adenosine triphosphate; dpf, days postfertilization; GO, Gene Ontology; KEGG, Kyoto Encyclopedia of Genes and Genomes; PFHxS, perfluorohexanesulfonic acid; PFOS, perfluorooctanesulfonic acid; RNA-seq, RNA sequencing; TCA, tricarboxylic acid. Go to Figure Open